TableView
The rows of the data around it as an HTML table, live: a Group's groups, a Sort's top rows, a Filter's kept rows; omitted from image exports.
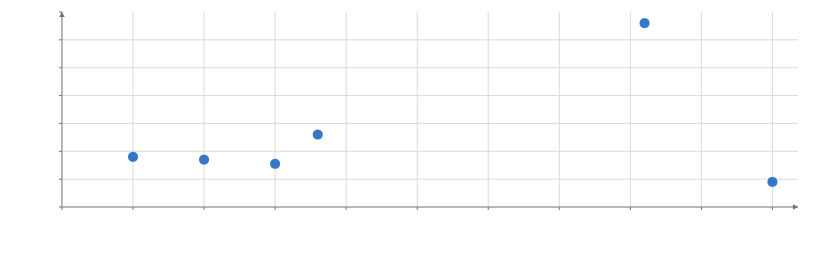
Static preview; loading the interactive plot
<script>
  import { Data, Filter, Plot, Points, Sort, TableView } from "hmplot";
  const cars = { model: ["Civic", "Corolla", "Golf", "Model 3", "Prius", "Mustang"],
    mpg: [36, 34, 31, 132, 52, 18], weight: [1250, 1300, 1350, 1610, 1380, 1700] };
</script>

<Data value={cars}>
  <Plot height={260} axes2d>
    <Points x="weight" y="mpg" brush />
  </Plot>
  <Filter where="@brushed" inactive="all">
    <Sort by="mpg" order="desc">
      <TableView columns={["model", { field: "mpg", format: ".0f" }]} limit={5} title="Most efficient" />
    </Sort>
  </Filter>
</Data>
Usage
TableView shows the rows of the data around it as an HTML table, and follows them: a Group’s groups, a Sort’s top rows, a Filter’s kept rows, a layout’s nodes. It is for the lists and readouts a dashboard shows beside its plots, such as the ten most efficient cars under a brush or each region’s total, without reading the rows into your own code. Put it inside the same Data as the plots (or inside the transform whose rows it shows), beside a Plot, never inside one.
with hm.Data(cars):
    with hm.Plot():
        hm.Points(x="weight", y="mpg", brush=True)
    with hm.Filter(where="@brushed", inactive="all"):
        with hm.Sort(by="mpg", order="desc"):
hm.TableView(columns=["model", {"field": "mpg", "label": "MPG", "format": ".1f"}], limit=10)<Data value={cars}>
<Plot><Points x="weight" y="mpg" brush /></Plot>
<Filter where="@brushed" inactive="all">
<Sort by="mpg" order="desc">
<TableView columns={["model", { field: "mpg", label: "MPG", format: ".1f" }]} limit={10} />
</Sort>
</Filter>
</Data>columnslists the columns in order, as names or{ field, label, format }; values are written as tooltips write them, numbers right-aligned. The default is every column.limit(100) is how many rows it shows; the rest are counted below it. The rows are read from the GPU when the data changes (a brush moving, an input),limitof them, never on every pointer move.selecton a row:trueselects its source rows in the data’s selection, as a click on a mark does, so plots of the same data thatrespondfade the others.input("model").set("model")writes the row’s value to an input instead (select on marks takes the same), and a second click on that row restores the input’s default.hoveron a row:truemarks its source rows@hovered;input("model").set("model")shows the row’s value in an input while the pointer is on it.- TableViews are omitted from PNG, SVG and PDF exports and kept in standalone HTML pages. For a number inside a plot, use Text of a Group’s column; for a sentence with live values, Title.