HMPlot

Facet

Small multiples: one cell per category, per field, or per pair of fields (a scatterplot matrix).
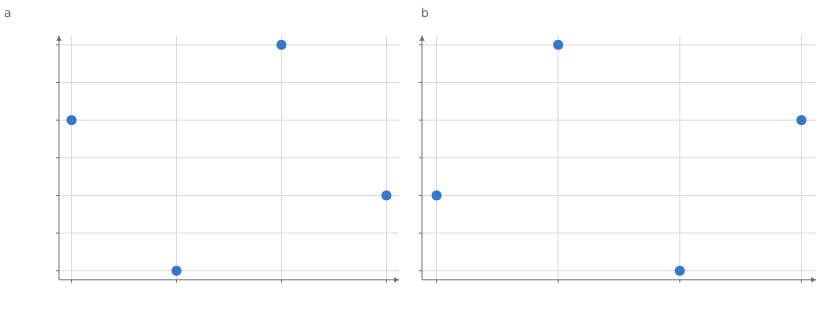
Scatter plot of y against x. x from 1 to 4, y from 0.9 to 4.1. 4 points. Scatter plot of y against x. x from 1 to 4, y from 0.9 to 4.1. 4 points.

Static preview; loading the interactive plot

<script>
  import { Facet, Plot, Points } from "hmplot";
  const data = {
    x: [1, 2, 3, 4, 1, 2, 3, 4],
    y: [3, 1, 4, 2, 2, 4, 1, 3],
    group: ["a", "a", "a", "a", "b", "b", "b", "b"],
  };
</script>

<Facet {data} column="group">
  <Plot height={300} axes2d>
    <Points x="x" y="y" />
  </Plot>
</Facet>

Options

cacheSizenumber
How many offscreen cells stay mounted besides the visible ones; 0 keeps none. Default: 64.
layout"bands" | "grid"
In a Facet inside a Plot, how the cells divide the plot: "bands" along the split dimension (the other dimension is the Plot's), or "grid", each cell with its own x and y. Default: "grid" with fields or pairs, else "bands".
bandPaddingnumber
The space between bands in the "bands" layout, as a fraction of a band. Default: 0.1.
datatable
A table or live pipeline output for the cells; the same as wrapping the Facet in Data.
keycolumn | column[]
The column, or columns, that identify each row of data across updates, as on Data.
namestring
The grid's name in its settings pane. Default: "Facet".
settings{showTrigger, showExport, menu}
showTrigger: false hides the grid's settings and export buttons; showExport: false hides its export button and its cells' Export menu entry; menu: false leaves the browser's own context menu on its cells.
rowcolumn
A categorical column: one row of cells per value.
columncolumn
A categorical column: one column of cells per value.
wrapnumber
The most cells across before the grid wraps, when only one dimension splits the cells.
gapnumber
Space between the cells. Default: 16 px.
rowOrdercategory[]
The rows to show, in order: values of row (a numeric row column needs this), or fields with fields or pairs. Rows with other values are left out. Default: the column's category order.
columnOrdercategory[]
The columns to show, in order, as rowOrder. Default: the column's category order.
fieldscolumn[] | {row} | {column}
One cell per field, over the same rows: in each cell the column value is that field and field holds its name. A list lays the cells along columns; {row: [...]} stacks them.
pairscolumn[] | {x, y}
A scatterplot matrix: each cell's x and y are two of these fields; {x: [...], y: [...]} makes a rectangular one. It cannot combine with row, column or fields.
triangle"full" | "upper" | "lower"
With a list of pairs, the cells of the whole matrix or of its upper or lower triangle. Default: "full".
diagonalboolean
With pairs, whether to draw the cells that pair a field with itself. Default: true.
as{value, field} | {x, y}
New names for the columns the cells alias ({value, field} with fields, {x, y} with pairs), when the table has columns of those names.
scales"shared" | "field" | "free-x" | "free-y" | "free-z" | "free"
How the cells share axis domains: "shared", one per axis; "field", one per plotted column; "free-x", "free-y", "free-z" or "free", each cell its own. Default: "field" with fields or pairs, else "shared".
resolve{color, size, width, shape}
Whether each appearance scale is "shared" across the cells or "independent" in each. Default: "shared" for each.
legendboolean | {position} | "cell"
One legend for the whole grid, explaining what the marks map from data and listing the labeled marks: true or {position} shows it, false hides it even when the cells ask for one, "cell" gives each cell its own. Default: the cells' legend around the grid (by default, a legend for each color mapped from a category column).
titlestring
A title above the grid, part of it on screen and in its exports.
subtitlestring
A line under the title, smaller and lighter.
captionstring
A note under the grid, such as its source, smaller and lighter.
schemaobject
Column types for data, such as {"day": "datetime"}, as on Data.

Usage

row/column choose partition fields; wrap is for single-field layouts. Shared domains are the default for categories, link defaults to auto, linking the shared axes, which the grid labels once on its outer cells. Cells preserve camera and settings by category identity. A transform inside the facet runs per subset.

Fields and pairs

fields={["temp", "rain"]} makes one cell per field over the same rows. Inside a cell, value is the cell’s field (its identity, metadata and scales: a strip brush on it constrains the field itself) and field holds the field’s name, one categorical column across the cells. A list lays the cells along columns ({column: [...]} says so explicitly); {row: [...]} stacks them; a categorical split may take the other dimension (fields={[...]} row="species"), and on the same dimension is an error. The order of the fields dimension (columnOrder for a list) picks and orders the fields; a name that is not one of them is an empty cell. pairs={["a", "b", "c"]} is a scatterplot matrix whose cells alias x and y to their two fields, with triangle (“full”, “upper”, “lower”) and diagonal; pairs={{x: [...], y: [...]}} is rectangular (columns from x, rows from y). as renames the aliases ({value, field} or {x, y}) when the table has columns of those names, which the aliases otherwise hide inside the cells. With fields or pairs, scales default to "field": a field keeps one domain across the cells (and across x and y in pairs), columns of the table stay shared, and values computed inside a cell follow the cell’s field. An embedded Facet with fields or pairs defaults to layout="grid". Every cell shows the same observations, so selection, hover and brushing work by observation across cells and connect(facet.endpoint("values")) needs no key. A Facet split by a Fold’s key still works and gives the same cells. The grid has one legend: cells add their marks to it, and legend (true or {position}) shows the automatic legend around the grid. legend="cell" restores one legend per cell.

Related examples

Facets & transforms