Edges
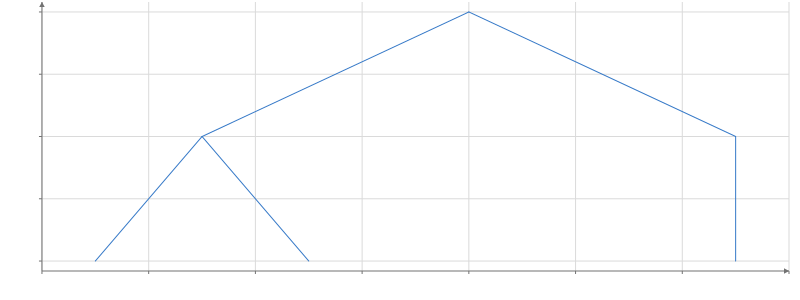
A graph layout's edges, one row each with start and end positions, for the marks inside to draw.
Static preview; loading the interactive plot
<script>
  import { Plot, Tree, Edges, Segments, GraphData } from "hmplot";
  const data = {
    source: ["root", "root", "a", "a", "b"],
    target: ["a", "b", "a1", "a2", "b1"],
  };
</script>

<Plot {data} height={300}>
  <GraphData source="source" target="target"
    ><Tree root="root">
      <Edges><Segments start="start" end="end" /></Edges>
    </Tree></GraphData
  >
</Plot>
Usage
Edges selects the edge relation from graph data, before or after a layout. Its children receive an ordinary table with the original edge attributes. Calculate, Filter and other table transforms can operate on it without coupling marks to the graph structure.
When node geometry is available, start and end lazily gather the current endpoint positions; sourceIndex and targetIndex identify the corresponding node rows. Filtering nodes induces only edges whose endpoints remain. Tree publishes its chosen spanning-tree edges; other layouts retain their documented edge mappings.