Dodge
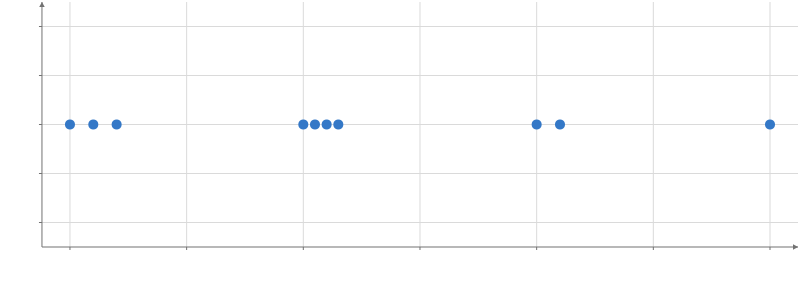
Moves overlapping points apart, for a beeswarm, or lays out one unit per row in a grid, for a unit (waffle) chart.
Static preview; loading the interactive plot
<script>
  import { Plot, Dodge, Points } from "hmplot";
  const data = { value: [1, 1.1, 1.2, 2, 2.05, 2.1, 2.15, 3, 3.1, 4] };
</script>

<Plot {data} height={300} axes2d>
  <Dodge x="value">
    <Points x="value" y={0} />
  </Dodge>
</Plot>
Usage
Adds pixel offsets consumed by one flat point mark, which takes them itself: no dy (or dx) is needed. With axis=“auto” (the default) the points move across a categorical x, or along x for a lone y, otherwise along y. Deterministic seed defaults to 42. Layout accounts for glyph sizes and changes with zoom or dimensions, but not pure pan. Supported for Cartesian 2D only.
To let the viewer change a setting, read an input in it: padding={input("padding")} (Python padding=hm.input.padding), where padding is a Slider.