Nodes
A graph's nodes, one row each, for the marks inside to draw.
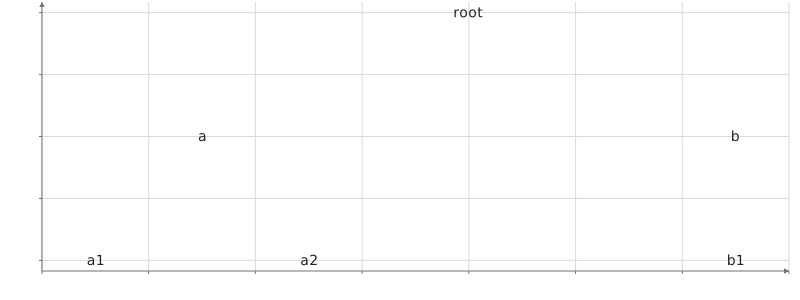
Static preview; loading the interactive plot
<script>
  import { Plot, Tree, Nodes, Text, GraphData } from "hmplot";
  const data = {
    source: ["root", "root", "a", "a", "b"],
    target: ["a", "b", "a1", "a2", "b1"],
  };
</script>

<Plot {data} height={300}>
  <GraphData source="source" target="target"
    ><Tree root="root">
      <Nodes><Text position="position" text="id" /></Nodes>
    </Tree></GraphData
  >
</Plot>
Usage
Nodes selects the node relation from graph data. It works before or after a layout and supplies an ordinary table to its children. Apply Calculate, Filter, Sort or Join inside it to transform nodes; use a nested Edges to switch back to the corresponding edge relation. Filtering nodes induces edges with both endpoints still present.
GraphData owns the node table and its nodeKey. To add attributes, supply them there, aggregate them from the edges with its reduce, or use the ordinary Join transform inside Nodes. Nodes has no separate data/key join API.
Layout columns include id, position, x/y/z and degree. Tree, Pack and Treemap also provide parent and depth; Pack adds r, and Treemap adds rectangle bounds. Tree exposes parent coordinates and partition bounds for animation. drag=true opts into Force dragging; static layouts do not simulate.