TextInput
Text edited by the viewer, updated on each keystroke.
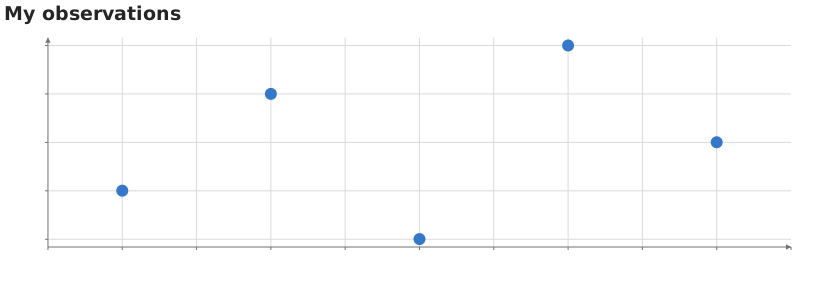
Static preview; loading the interactive plot
<script>
  import { TextInput, InputContext, Plot, Points, input } from "hmplot";
  const data = { x: [1, 3, 5, 7, 9], y: [2, 4, 1, 5, 3] };
</script>

<InputContext>
  <TextInput name="caption" value="My observations" placeholder="Plot title" />
  <Plot {data} height={300} axes2d title={"{$caption}"}>
    <Points x="x" y="y" size={12}  />
  </Plot>
</InputContext>
Usage
Enter a string. The value updates on each keystroke; clearing the box publishes an empty string. placeholder supplies a hint while the box is empty and does not become its value. A string used as a mark channel can name a column; the example uses it as a plot title.
Place the control beside the plot in an InputContext (JavaScript) or Scene (Python). Readers use input("name") or hm.input.name. The name must be unique in that context.
Static image exports show the plot at the current values and omit the controls.