Pivot
A long table made wide: a row per group and a column per category of a field.
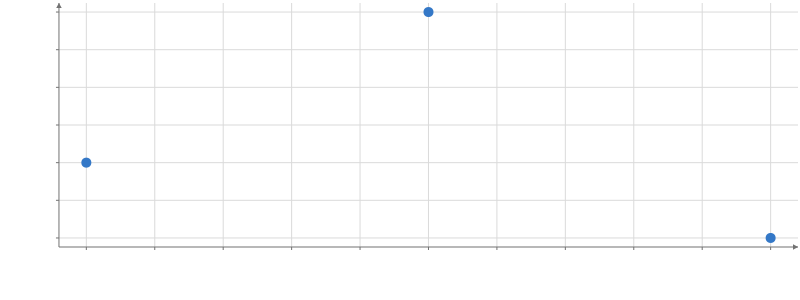
Static preview; loading the interactive plot
<script>
  import { Plot, Pivot, Points, sum } from "hmplot";
  const data = {
    shape: ["a", "a", "b", "b", "c", "c"],
    measure: ["width", "height", "width", "height", "width", "height"],
    value: [1, 2, 3, 1, 2, 4],
  };
</script>

<Plot {data} height={300} axes2d>
  <Pivot field="measure" value={sum("value")} by="shape">
    <Points x="width" y="height" />
  </Pivot>
</Plot>
Usage
Outputs one row per by key and a column per field category (first and second in this excerpt). value is a reduction expression that fills each cell from the group’s rows in that category: value={sum("value")} (Python value=hm.sum("value")), mean("value") or count(). Missing combinations become NaN. Duplicate output names and source-column collisions are errors.
To let the viewer change a setting, read an input in it: by={input("by")} (Python by=hm.input.by), where by is a Select of column names.