Legends & uncertainty
Series legends, GPU colorbars, filled areas, and capped uncertainty intervals.
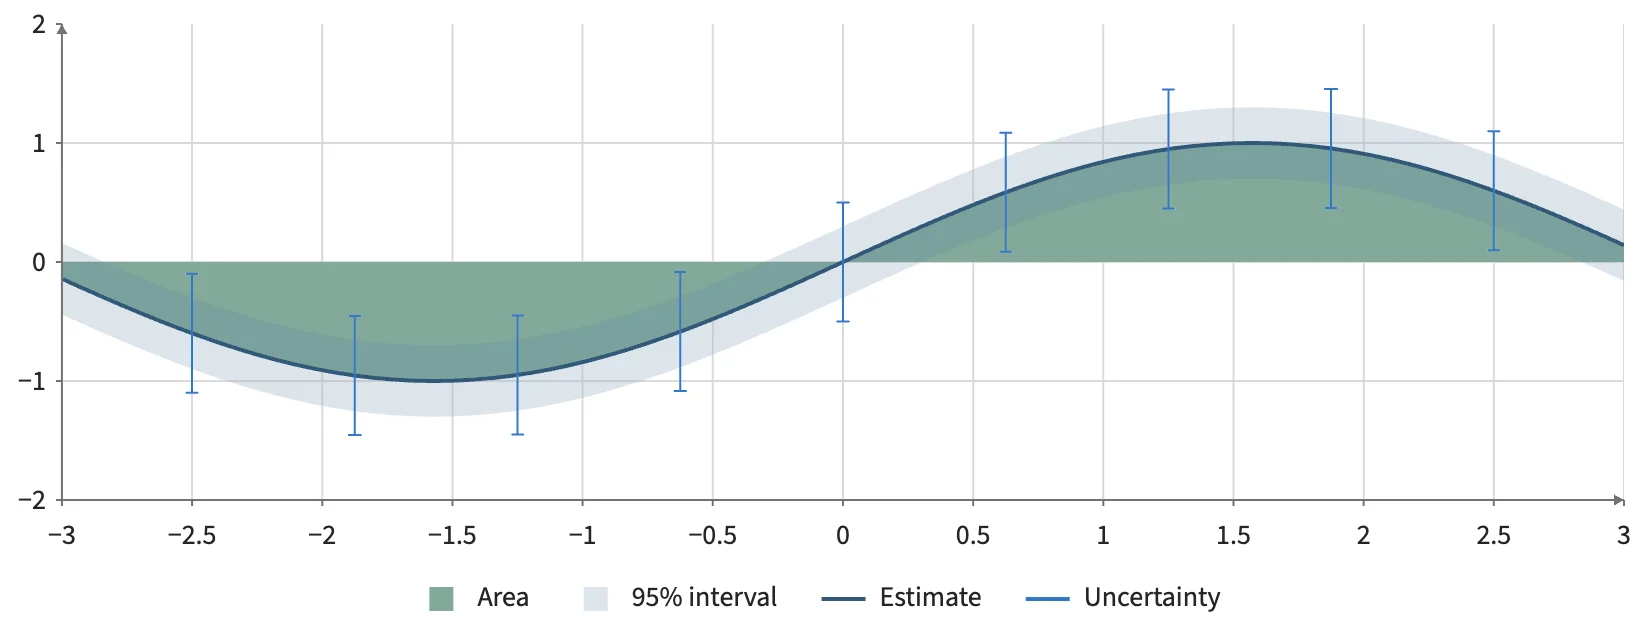
Static preview; loading the interactive plot
<Plot legend>
  <Area x={x} lower={lower} upper={upper} opacity={0.2} label="95% interval" />
  <Line position={estimate} label="Estimate" />
  <ErrorBars position={observations} lower={lowerBounds} upper={upperBounds} />
</Plot>
<Legend for={heatmap} channel="fill" label="Density" />