Days of the week and calendar months
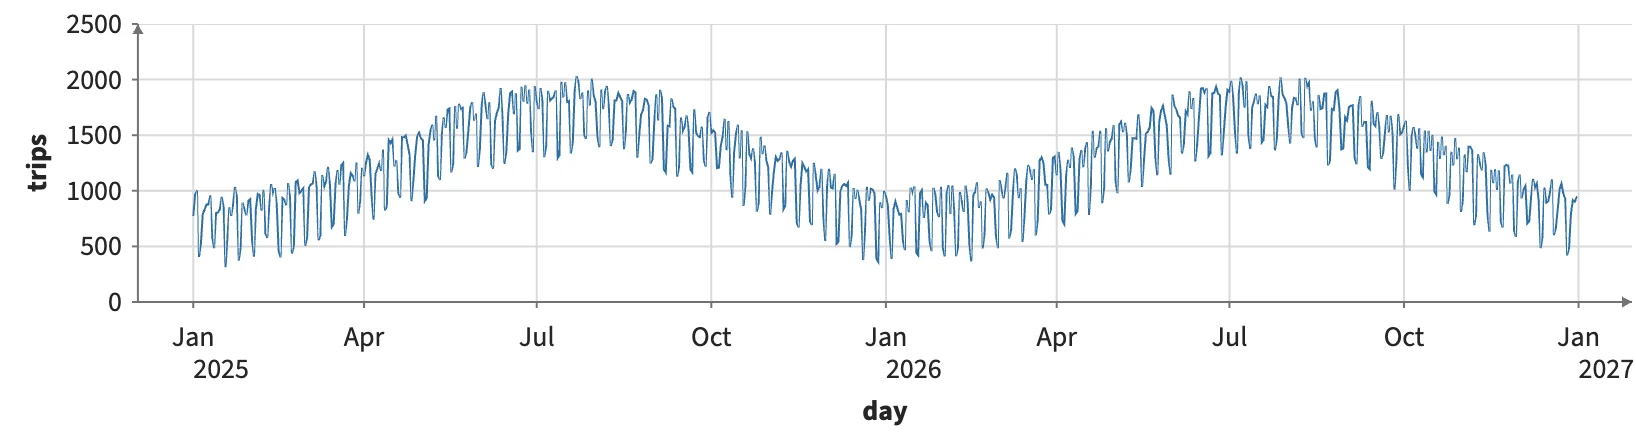
Two years of daily trips: grouped by day_name into weekdays, Monday first, and binned by calendar month with Bin's interval, whose bars start and end at month boundaries.
Static preview; loading the interactive plot
<Data value={data}>
  <Plot axes2d><Line x="day" y="trips" /></Plot>
  <Calculate columns={{ weekday: day_name("day") }}>
    <Group by="weekday" columns={{ mean: mean("trips") }}>
      <Plot axes2d><Bar x="weekday" y="mean" /></Plot>
    </Group>
  </Calculate>
  <Bin x="day" interval="1 month" columns={{ total: sum("trips") }}>
    <Plot axes2d><Rect x0="x0" x1="x1" y0={0} y1="total" /></Plot>
  </Bin>
</Data>