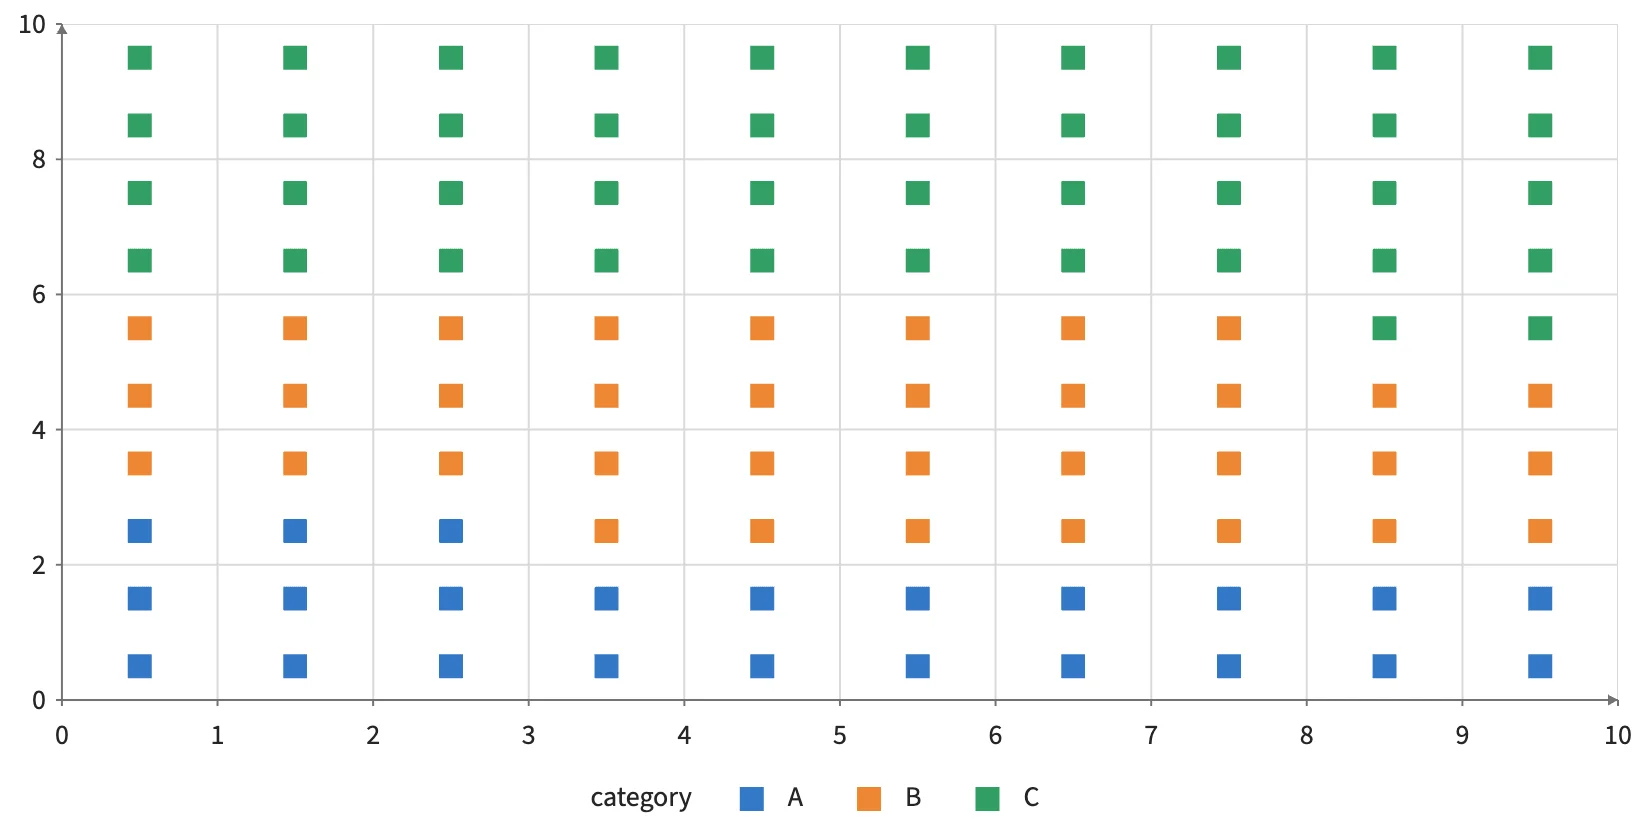
Waffle grid
Integer counts expand into source-identified unit squares, ordered left to right and bottom to top.
Static preview; loading the interactive plot
<script>
  import { Plot, Dodge, Points } from "hmplot";
  const data = { category: ["A", "B", "C"], count: [23, 35, 42] };
</script>
<Plot {data} responsive height={420} x={{domain:[0,10]}} y={{domain:[0,10]}}>
  <Dodge mode="grid" columns={10} count="count">
    <Points x="x" y="y" fill="category" shape="square" size={12} />
  </Dodge>
</Plot>