Unified x tooltip
Move the pointer along the dates: one tooltip lists every series' value at that date, with a marker on each line, beside a Crosshair's vertical rule.
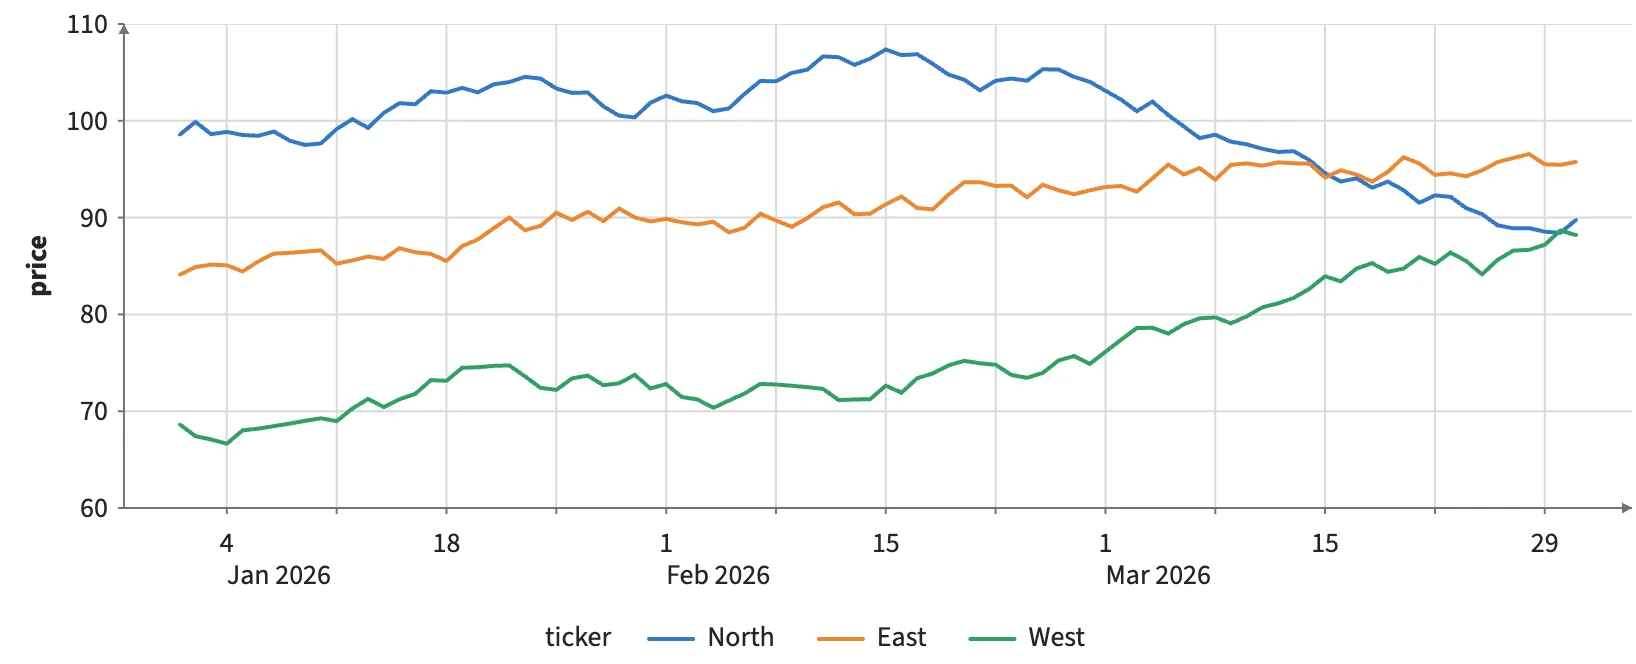
Static preview; loading the interactive plot
<script>
  import { Plot, Line } from "hmplot";
import { Crosshair } from "hmplot/charts";
  const day = 86400000, start = Date.UTC(2026, 0, 1);
  const prices = { date: [], price: [], ticker: [] };
  ["North", "East", "West"].forEach((ticker, k) => {
    for (let i = 0; i < 90; i++) {
      prices.date.push(new Date(start + i * day));
      prices.price.push(100 - k * 15 + Math.sin(i / 7 + k) * 8 + i * 0.1);
      prices.ticker.push(ticker);
    }
  });
</script>
<Plot data={prices} responsive height={340} axes2d tooltip={{ mode: "x" }} y={{ label: "price" }}>
  <Line x="date" y="price" series="ticker" color="ticker" width={2} />
  <Crosshair axes="x" readout={false} />
</Plot>