Tooltips
Point near a penguin: the tooltip shows the nearest one within 16 pixels, with chosen fields, labels and formats, and @tooltip enlarges it; a histogram's bars show their bin and count.
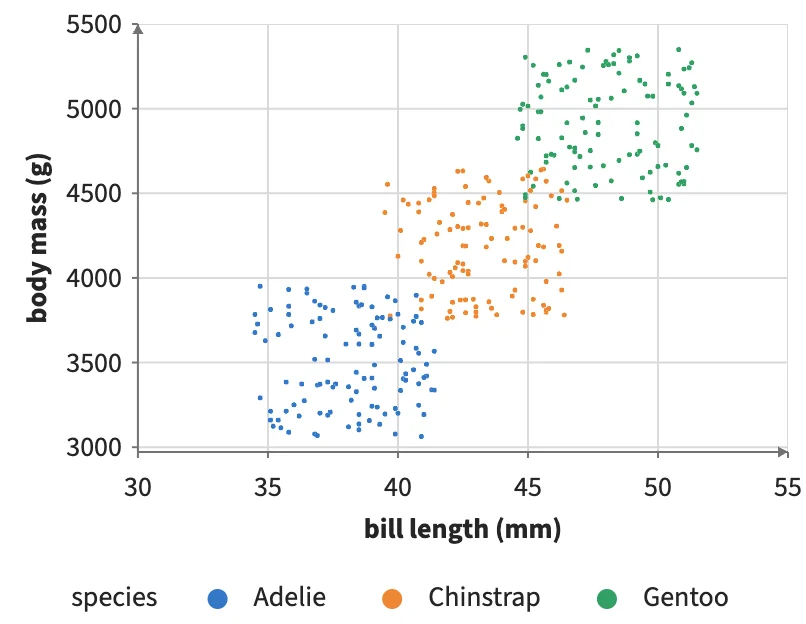
Static preview; loading the interactive plot
<script>
  import { Plot, Points, where } from "hmplot";
import { Histogram } from "hmplot/charts";
  const species = ["Adelie", "Chinstrap", "Gentoo"], islands = ["Biscoe", "Dream", "Torgersen"];
  const penguins = { species: [], island: [], bill: [], mass: [] };
  for (let i = 0; i < 330; i++) {
    penguins.species.push(species[i % 3]);
    penguins.island.push(islands[(i * 7) % 3]);
    penguins.bill.push(38 + (i % 3) * 5 + Math.sin(i) * 3.5);
    penguins.mass.push(3500 + (i % 3) * 700 + Math.cos(i * 1.7) * 450);
  }
</script>
<Plot data={penguins} responsive height={320} axes2d>
  <Points x="bill" y="mass" fill="species" size={where("@tooltip", 5, 2.5)}
    tooltip={["island", "bill", { field: "mass", label: "body mass (g)", format: ",.0f" }]} />
</Plot>
<Plot data={penguins} responsive height={320} axes2d tooltip>
  <Histogram x="mass" bins={20} fill="#547ba2" />
</Plot>