Portable ridgeline template
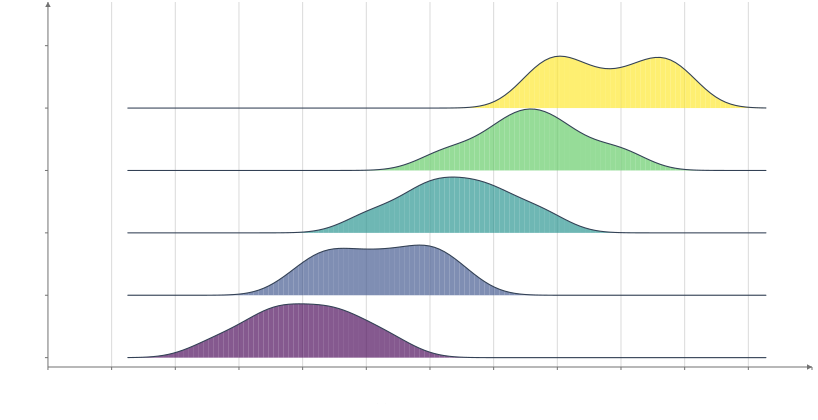
Grouped Gaussian densities in one shared frame, packaged as a downloadable template. Change the data, bandwidth and ridge height.
Static preview; loading the interactive plot
<script>
  import { Plot } from "hmplot";
  import { PortableTemplate } from "hmplot/templates";
  import { untrack } from "svelte";
  import definition from "./ridgeline.hmplot.json";
  import download from "./ridgeline.hmplot.json?url";
  import data from "./data.json";
  let { onready } = $props(), plot = $state();
  $effect(() => { const p = plot; untrack(() => onready?.(p)); });
</script>
<p>Simulated measurements for five ordered groups. value is numeric; group is a numeric baseline index (0, 1, …), not a category name. bandwidth uses value units and gain sets the vertical density multiplier. All groups share a measurement scale. <a href={download} download="ridgeline.hmplot.json">Download template</a></p>
<Plot bind:this={plot} {data} responsive height={420} x={{"label": "Measurement"}} y={{"label": "Group", "step": 1, "grid": "off", "domain": [-0.15, 5.7]}}>
  <PortableTemplate {definition} params={{}} />
</Plot>
<style>p {font-size:14px;line-height:1.5}</style>