Portable radar template
A portable polygon template maps normalized scores to a radar chart. Rings, spokes and labels are supplied by the host.
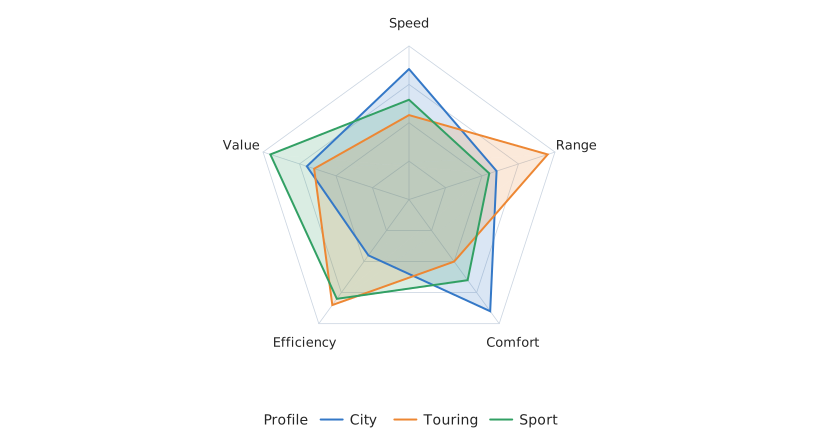
Static preview; loading the interactive plot
<script>
  import { Plot, Data, Line, Text, Legend } from "hmplot";
  import { PortableTemplate } from "hmplot/templates";
  import { untrack } from "svelte";
  import definition from "./radar.hmplot.json";
  import download from "./radar.hmplot.json?url";
  import data from "./data.json";
  import guides from "./guides.json";
  let { onready } = $props(), plot = $state();
  $effect(() => { const p = plot; untrack(() => onready?.(p)); });
</script>
<p>Simulated profiles; dimension is an ordered index 0–count (repeat the first score at count to close the outline), score is already normalized to 0–1, and profile identifies each polygon. The host supplies a square equal-aspect frame and optional rings, spokes and labels; the template does not infer comparable units. <a href={download} download="radar.hmplot.json">Download template</a></p>
<Plot bind:this={plot} {data} responsive height={440} axes2d={false} aspect={"equal"} x={{"domain": [-1.3, 1.3]}} y={{"domain": [-1.3, 1.3]}}>
  <Data value={guides.rings}><Line x="x" y="y" series="ring" color="#cbd5e1" width={0.8} legend={false} /></Data>
  <Data value={guides.spokes}><Line x="x" y="y" series="spoke" color="#cbd5e1" width={0.8} legend={false} /></Data>
  <Data value={guides.labels}><Text x="x" y="y" text="text" size={13} /></Data>
  <PortableTemplate {definition} params={{}} />
  <Legend channel="color" label="Profile" position="bottom" />
</Plot>
<style>p {font-size:14px;line-height:1.5}</style>