Portable parallel coordinates
Fold and Normalize turn a wide table into comparable dimensions. A portable Line template draws one profile per observation.
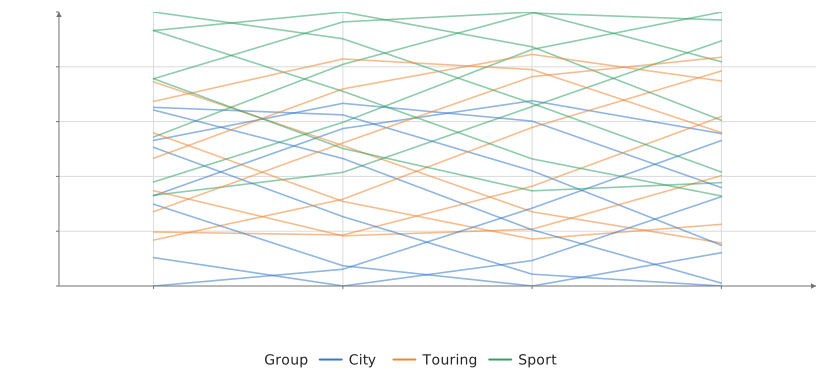
Static preview; loading the interactive plot
<script>
  import { Plot, Legend } from "hmplot";
  import { PortableTemplate } from "hmplot/templates";
  import { untrack } from "svelte";
  import definition from "./parallel.hmplot.json";
  import download from "./parallel.hmplot.json?url";
  import data from "./data.json";
  let { onready } = $props(), plot = $state();
  $effect(() => { const p = plot; untrack(() => onready?.(p)); });
</script>
<p>Simulated product profiles. Supply one row per observation with a unique id, categorical group, and numeric measure columns. fields determines dimension order. Each measure is normalized across visible rows to 0–1; this is not a shared physical unit scale. <a href={download} download="parallel.hmplot.json">Download template</a></p>
<Plot bind:this={plot} {data} responsive height={380} x={{"label": "Measure"}} y={{"label": "Relative value", "domain": [0, 1]}}>
  <PortableTemplate {definition} params={{"fields": ["speed", "range", "comfort", "efficiency"]}} />
  <Legend channel="color" label="Group" position="bottom" />
</Plot>
<style>p {font-size:14px;line-height:1.5}</style>