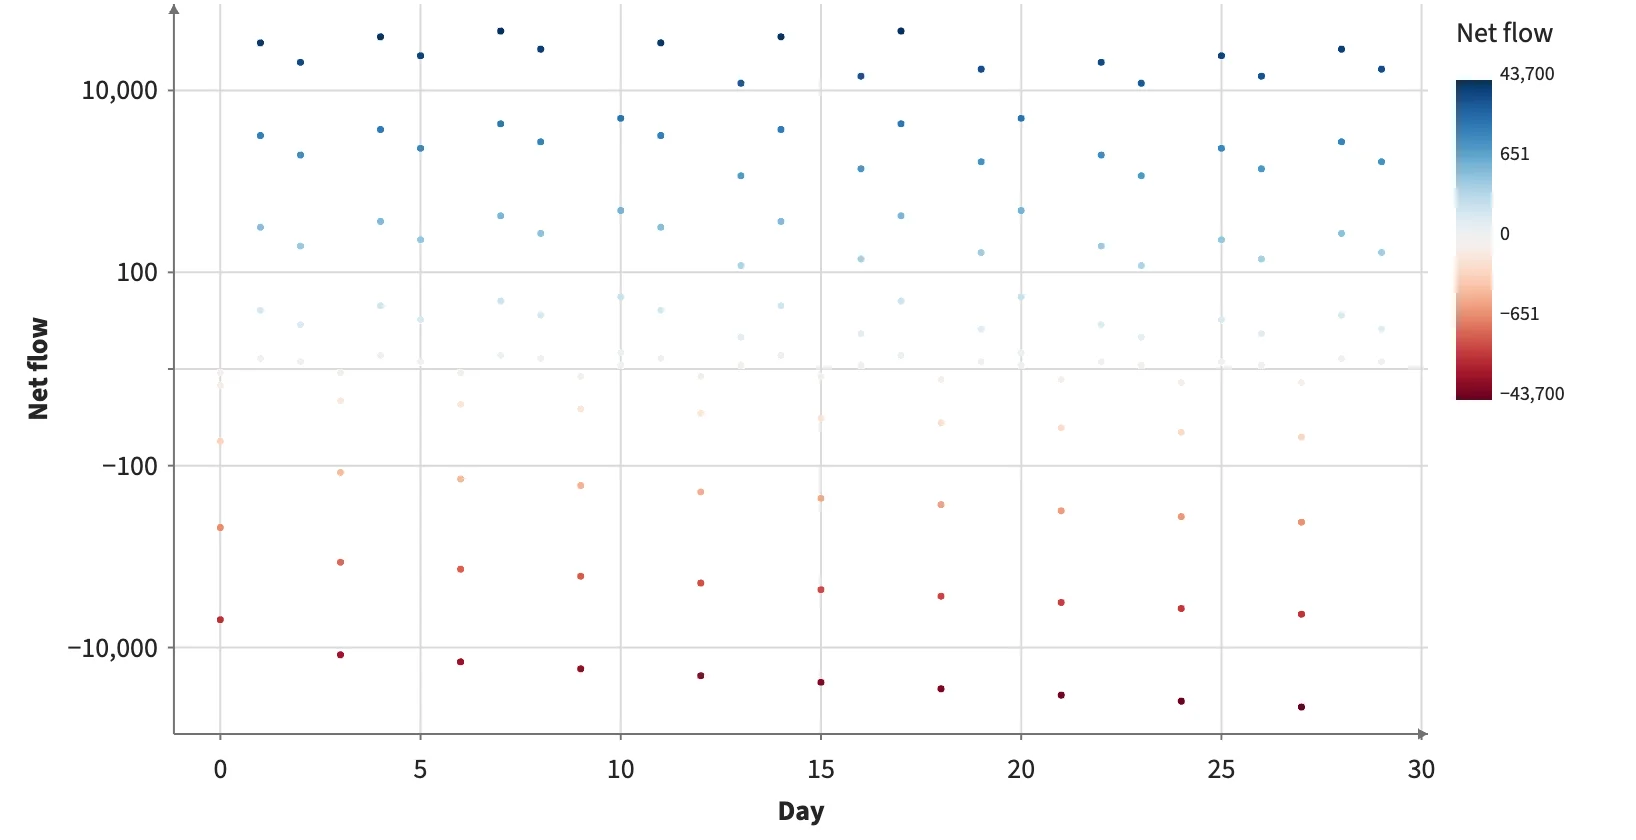
Symlog axis and a diverging scale
Values that cross zero with a wide range: a symlog y axis is linear within ±10 and logarithmic beyond, so small days and large ones both read, and outflows are drawn (a log axis would drop them). The color scale's midpoint puts RdBu's white at 0 and uses both ends of the colormap.
Static preview; loading the interactive plot
<script>
  import { Plot, Points, Legend, continuous } from "hmplot";
  // flow: daily net flows, a few units most days and tens of thousands on a few.
  const scale = continuous({ colormap: "RdBu", transform: "symlog", constant: 10, midpoint: 0 });
  let points = $state();
</script>
<Plot {data} responsive height={420} axes2d
  x={{ label: "Day" }} y={{ transform: "symlog", constant: 10, label: "Net flow" }}>
  <Points bind:this={points} x="day" y="flow" fill="flow" fillScale={scale} size={3.5} />
  <Legend for={points} channel="fill" label="Net flow" position="right" />
</Plot>