One brush, three strips
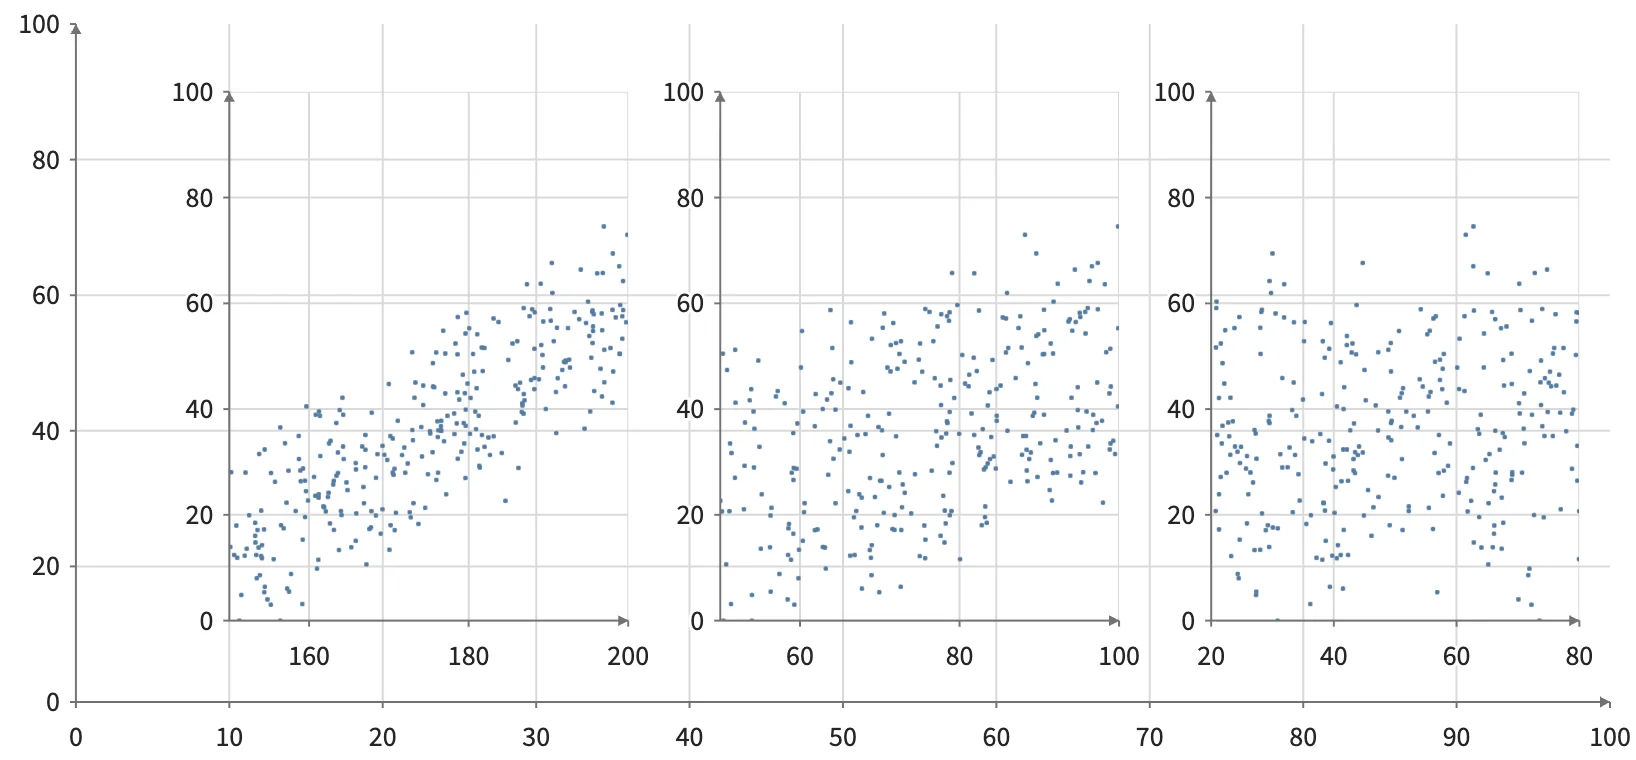
Three child frames plot score against different fields. Shift-drag any tick strip: the shared score brush appears on every strip. Drag band ends to resize, the middle to move, scroll to scale, and use arrow keys or Escape.
Static preview; loading the interactive plot
<script>
  import { Plot, Frame, Points, Text, where } from "hmplot";
  const count = 300;
  // A deterministic pseudo-random sequence, so the gallery renders the same rows every time.
  const noise = (i, k) => { const v = Math.sin(i * 12.9898 + k * 78.233) * 43758.5453; return v - Math.floor(v); };
  const data = {
    height: Array.from({length: count}, (_, i) => 150 + 50 * noise(i, 1)),
    weight: Array.from({length: count}, (_, i) => 50 + 50 * noise(i, 2)),
    age: Array.from({length: count}, (_, i) => 20 + 60 * noise(i, 3)),
  };
  data.score = data.height.map((h, i) => Math.min(100, Math.max(0, 0.9 * (h - 150) + 0.5 * (data.weight[i] - 50) + 20 * (noise(i, 4) - 0.5))));
  const panels = [["height", [150, 200], [10, 36]], ["weight", [50, 100], [42, 68]], ["age", [20, 80], [74, 98]]];
</script>
<Plot data={data} responsive height={380} x={{domain: [0, 100]}} y={{domain: [0, 100]}}>
  {#each panels as [field, domain, range]}
    <Frame x={{domain, range}} y={{domain: [0, 100], range: [12, 90]}}>
      <Points x={field} y="score" brush={{axis: "y"}} fill="#547ba2" size={where("@any_brushed", where("@brushed", 4.5, 1), 2.5)} />
      <Text position={[[(domain[0] + domain[1]) / 2, 104]]} text={[field]} size={12} />
    </Frame>
  {/each}
</Plot>