Running totals under a brush
Shift-drag to brush 50,000 transactions; the brushed rows are sorted by day, then a running sum and a 500-row moving average follow the brush (Filter > Sort > Window > Line).
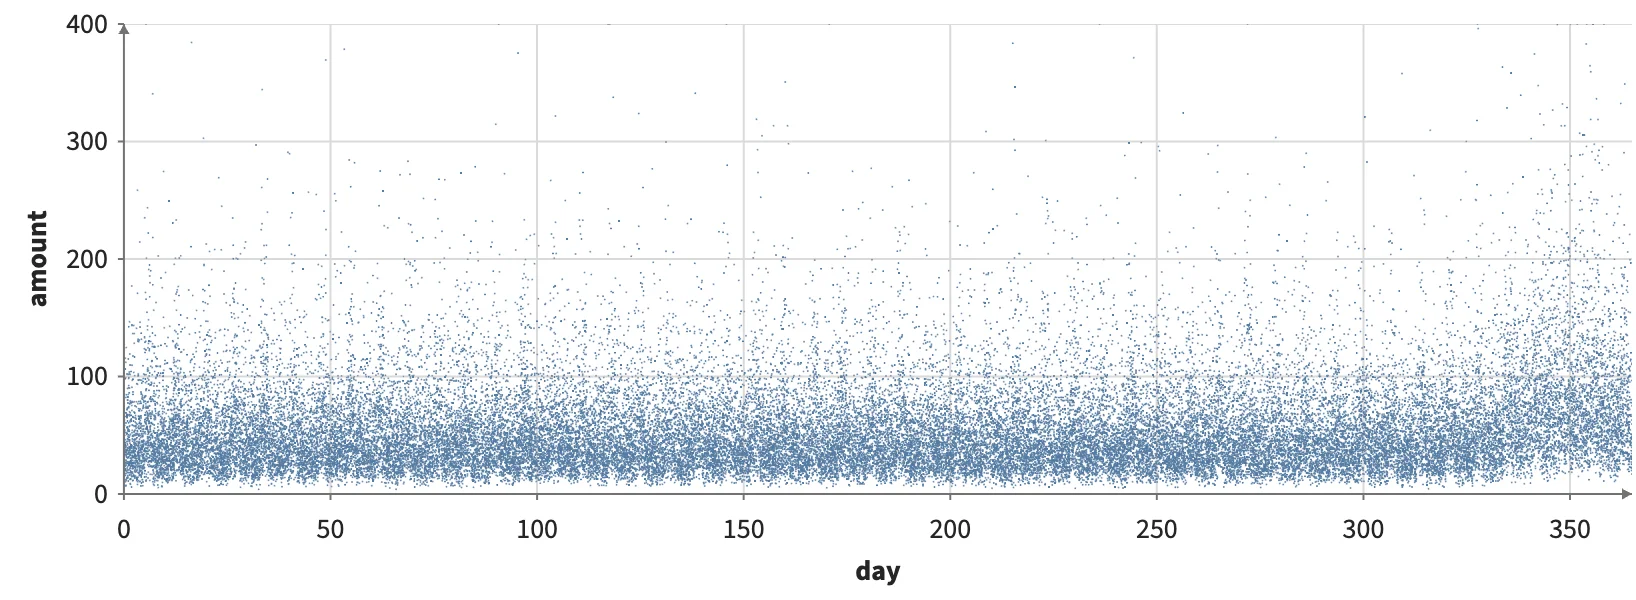
Static preview; loading the interactive plot
<script>
  import { Data, Plot, Points, Filter, Sort, Line } from "hmplot";
import { Window } from "hmplot/stats";
  // table: 50,000 rows with day (0-365, unsorted) and amount.
</script>
<Data value={table}>
  <Plot axes2d x={{ domain: [0, 365] }} y={{ domain: [0, 400] }}>
    <Points x="day" y="amount" size={1} brush maxElements={50000} />
  </Plot>
  <Plot axes2d x={{ domain: [0, 365] }}>
    <Filter where="@brushed"><Sort by="day">
      <Window field="amount" size={50000} reduce="sum" as="total"><Line x="day" y="total" /></Window>
    </Sort></Filter>
  </Plot>
  <Plot axes2d x={{ domain: [0, 365] }}>
    <Filter where="@brushed"><Sort by="day">
      <Window field="amount" size={500} reduce="mean" as="average"><Line x="day" y="average" /></Window>
    </Sort></Filter>
  </Plot>
</Data>