Ridgeline temperatures
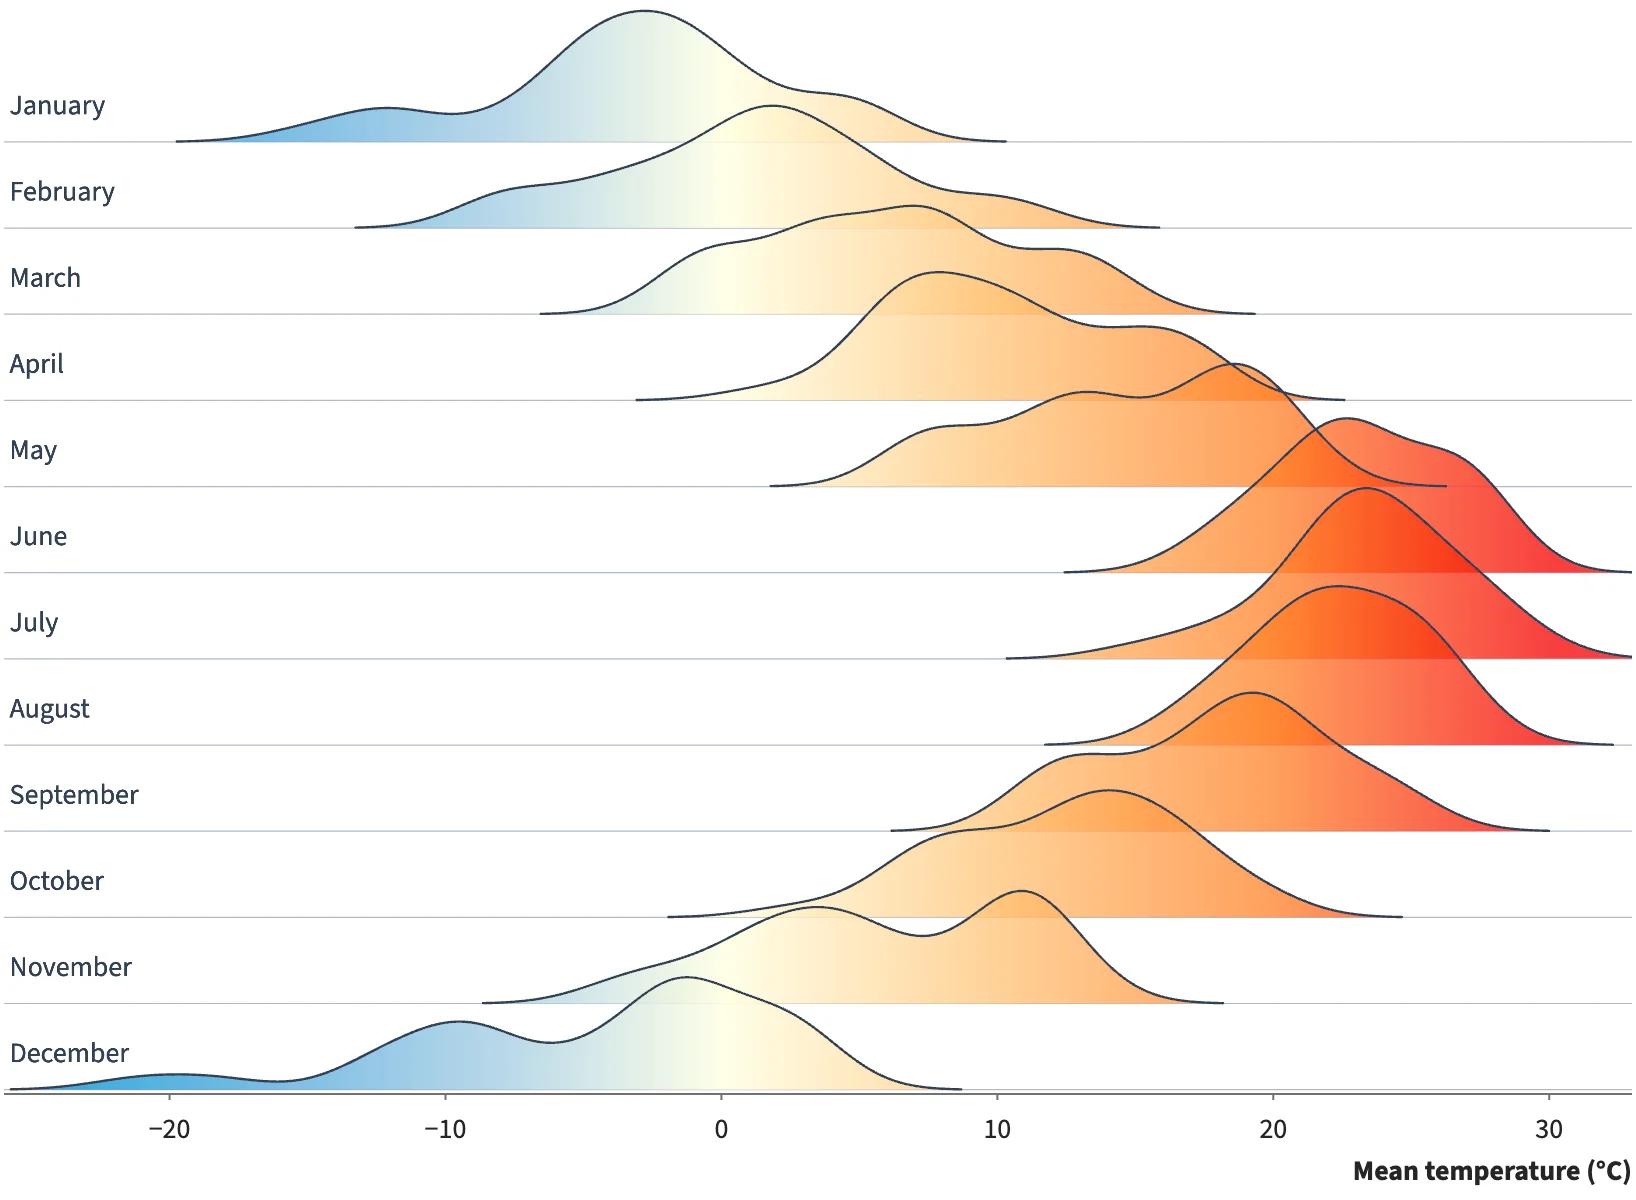
Twelve monthly temperature densities from Lincoln's 2016 weather, with overlapping ridges and a shared blue-to-red temperature gradient.
Static preview; loading the interactive plot
<Density x="temperature" by="month" bandwidth={4 / Math.sqrt(5)}>
  <Calculate columns={{ baseline: subtract(11, "month"), ridge: add(subtract(11, "month"), multiply("density", 1 / 0.06)) }}>
    <Area x="x" upper="ridge" lower="baseline" series="month" fill="x" fillScale={temperatureColor} opacity={0.75} blend="multiply" />
    <Line x="x" y="ridge" series="month" />
  </Calculate>
</Density>