RGB colors from data
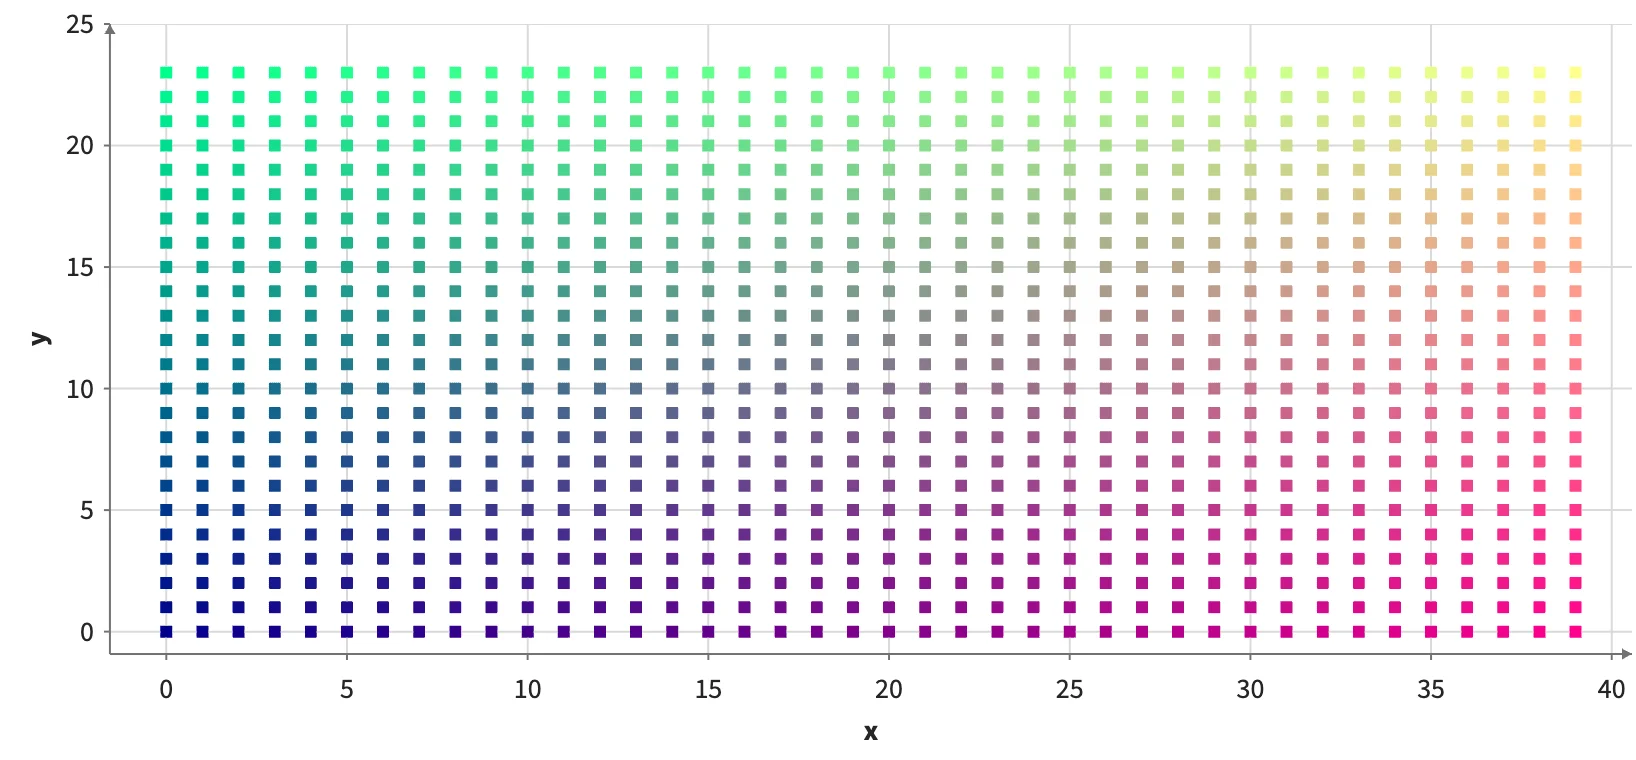
Color each point from red, green, and blue columns. Integer data is 0-255 and float data 0-1; RGB colors bypass scales and legends.
Static preview; loading the interactive plot
<script>
  import { Plot, Points } from "hmplot";
  // A 40 x 24 grid whose colors come straight from data: red grows left to right,
  // green bottom to top, and blue is fixed. Integer columns are 0-255.
  const columns = 40, rows = 24;
  const cells = Array.from({ length: columns * rows }, (_, i) => [i % columns, Math.floor(i / columns)]);
  const data = {
    x: cells.map(([c]) => c), y: cells.map(([, r]) => r),
    red: Uint8Array.from(cells, ([c]) => Math.round((c / (columns - 1)) * 255)),
    green: Uint8Array.from(cells, ([, r]) => Math.round((r / (rows - 1)) * 255)),
    blue: Uint8Array.from(cells, () => 140),
  };
</script>
<Plot data={data} responsive height={380} axes2d toneMapping={0}>
  <Points x="x" y="y" fill={{ r: "red", g: "green", b: "blue" }} shape="square" size={6} />
</Plot>