An RGB image from band columns
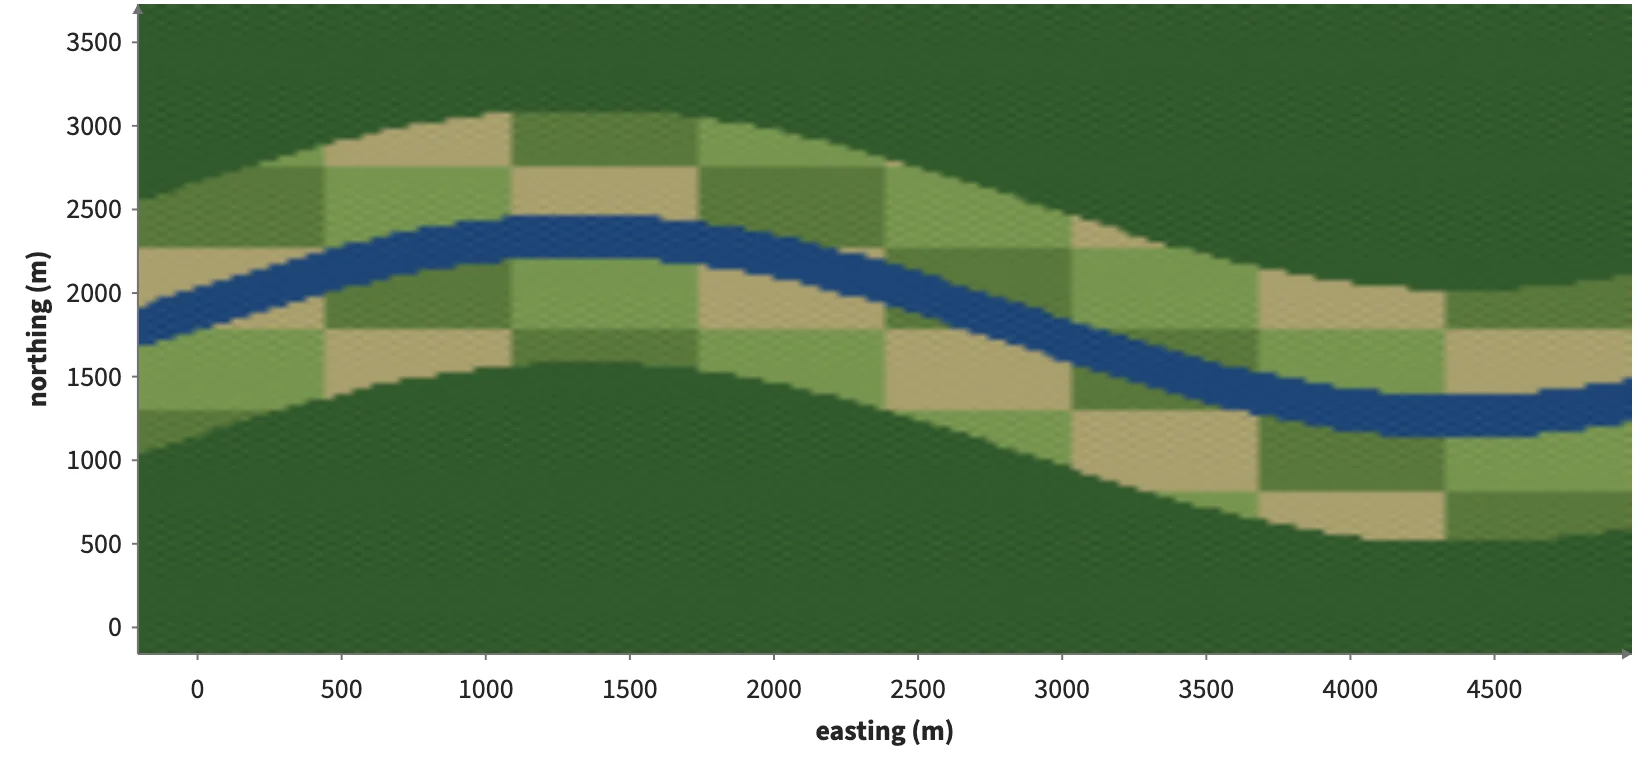
An Image's fill takes { r, g, b } columns, as every mark's RGB channel does: three satellite-style bands of a grid table (integers 0-255) make the image, placed by the grid's coordinates.
Static preview; loading the interactive plot
<Data value={gridTable({ dims: { y, x }, columns: { B04: red, B03: green, B02: blue } })}>
  <Plot responsive height={380} axes2d>
    <Image fill={{ r: "B04", g: "B03", b: "B02" }} />
  </Plot>
</Data>