Earthquakes by year, loaded on demand
A Provider loads one year of real earthquakes (USGS, magnitude 4.5+) from a static CSV when the Year input changes. The previous year stays drawn until the next one arrives, a year already on screen loads nothing, and the Refresh button loads it again.
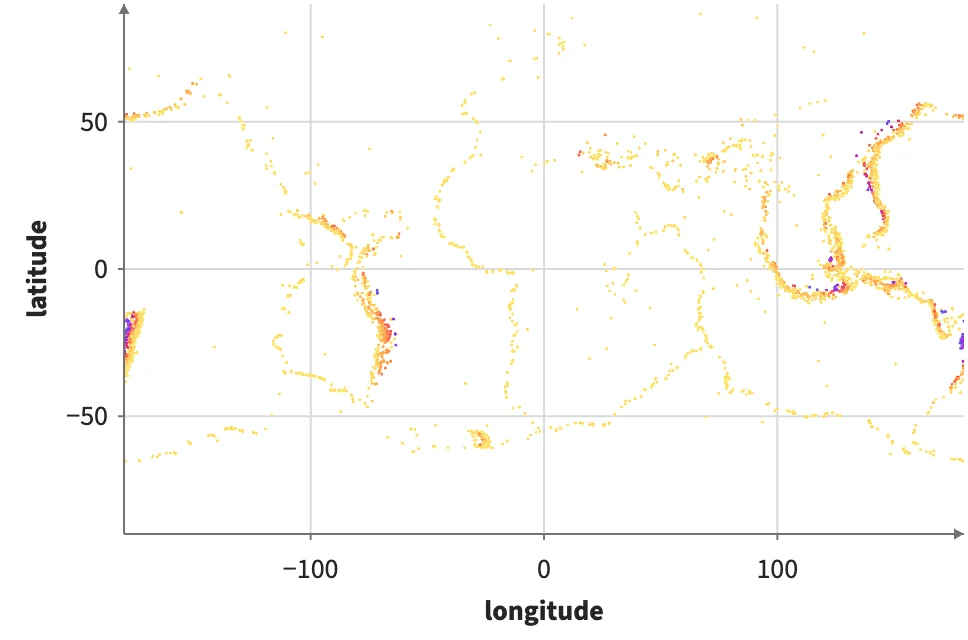
Static preview; loading the interactive plot
<script>
  import { Provider, Plot, Points, Rect, Button, InputContext, Select, continuous, input } from "hmplot";
import { Bin } from "hmplot/stats";
  const depthColors = continuous({ domain: [0, 700], colormap: ["#ffe066", "#ff7b39", "#e0245e", "#8e2de2", "#4361ee"] });
  const magnitudeEdges = Array.from({ length: 41 }, (_, i) => +(4.5 + i * 0.1).toFixed(1));
</script>
<InputContext>
  <Select name="year" options={[2015, 2016, 2017, 2018, 2019, 2020, 2021, 2022, 2023, 2024]} value={2024} label="Year" />
  <!-- Each press loads the year again. -->
  <Button name="reload" label="Refresh" />
  <!-- A JavaScript string: in a quoted attribute, Svelte would read {year} as an expression. -->
  <Provider url={"/data/earthquakes/by-year/{year}.csv"} format="csv" params={{ year: input("year") }} refresh={input("reload")}>
    <Plot height={320} axes2d x={{ domain: [-180, 180] }} y={{ domain: [-90, 90] }}>
      <Points x="lon" y="lat" fill="depth" fillScale={depthColors} size={1.5} />
    </Plot>
    <Plot height={320} axes2d x={{ domain: [4.5, 8.5] }} y={{ domain: [0.8, 5000], transform: "log" }}>
      <Bin x="mag" bins={magnitudeEdges}><Rect x0="x0" x1="x1" y0={0.8} y1="count" fill="#e0245e" /></Bin>
    </Plot>
  </Provider>
</InputContext>