Pies in a Facet
Small multiples: a Facet repeats the Plot once per year, and each Pie sums its own year's sales, with one legend for the row.
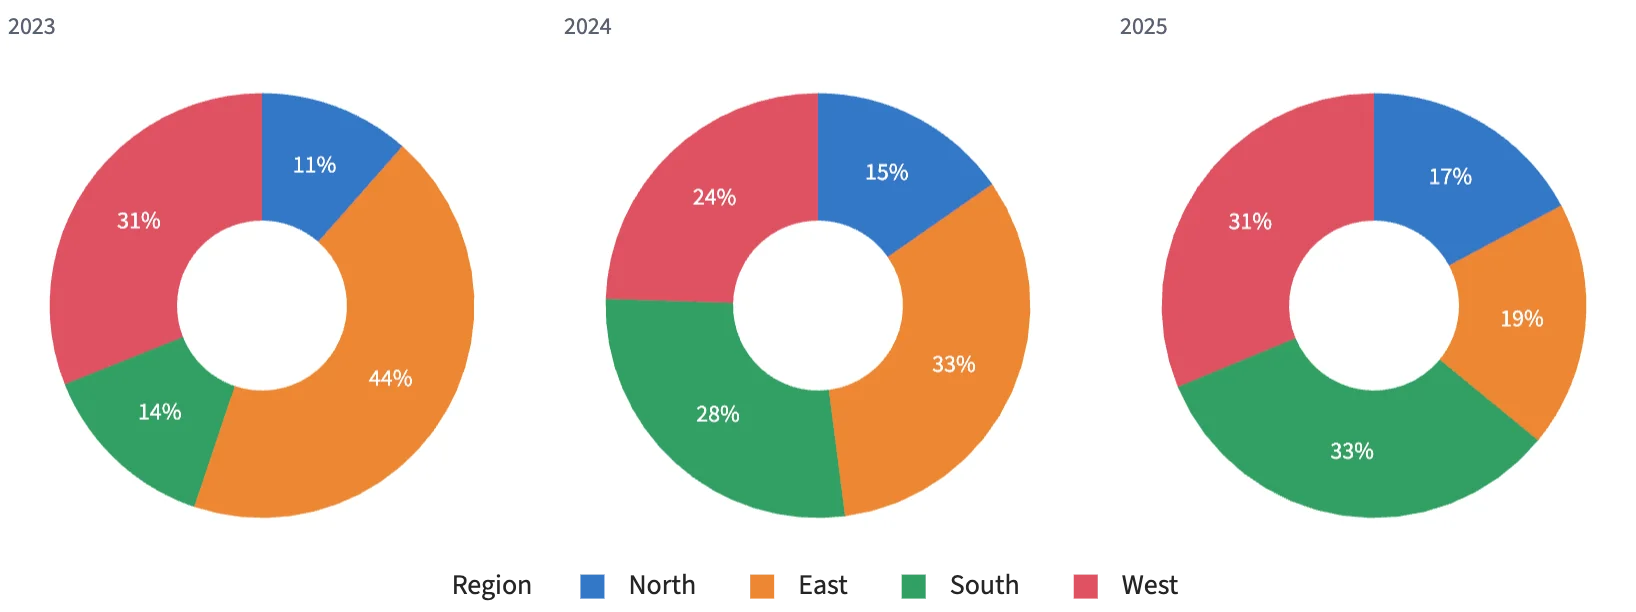
Static preview; loading the interactive plot
<script>
  import { Plot, Facet, Legend } from "hmplot";
import { Pie } from "hmplot/charts";
  // One row per year and region.
  const regions = ["North", "East", "South", "West"];
  const sales = {
    year: ["2023", "2024", "2025"].flatMap((year) => regions.map(() => year)),
    region: [...regions, ...regions, ...regions],
    sales: [10, 38, 12, 27, 15, 32, 27, 24, 11, 12, 21, 20],
  };
</script>
<Facet data={sales} column="year">
  <Plot height={240}>
    <Pie value="sales" category="region" innerRadius={0.4} sectorLabel="percent" />
    <Legend channel="fill" label="Region" position="bottom" />
  </Plot>
</Facet>