Pie chart
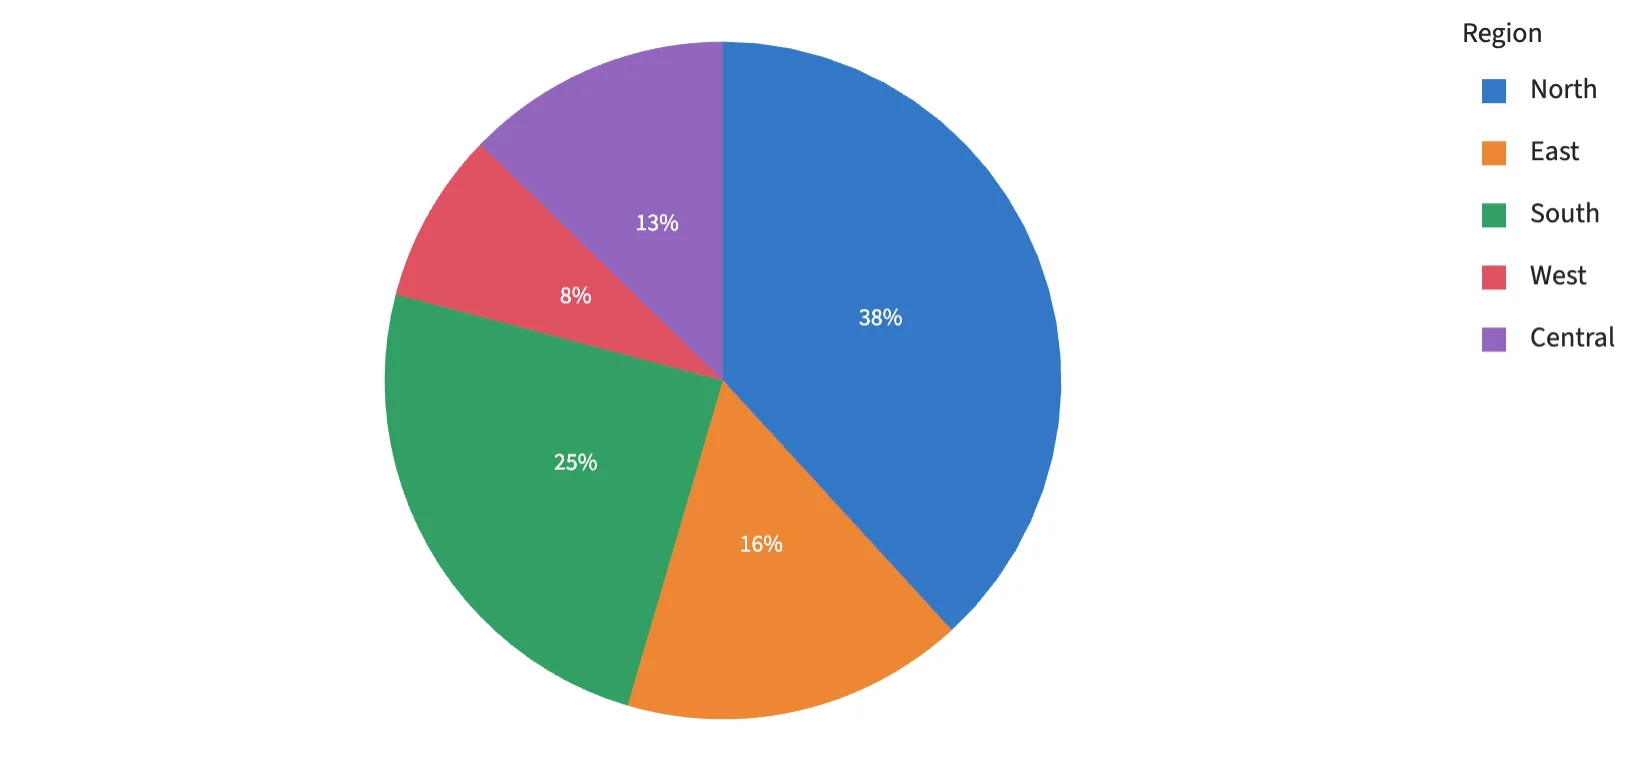
Each region's share of the sales, clockwise from 12 o'clock, labeled with its percentage. Pie is a built-in template: a PieGeometry transform and Rects in a polar Frame, which it places in a Cartesian Plot.
Static preview; loading the interactive plot
<script>
  import { Plot, Legend } from "hmplot";
import { Pie } from "hmplot/charts";
  let pie = $state();
  const data = {
    region: ["North", "East", "South", "West", "Central"],
    sales: [42, 18, 27, 9, 14],
  };
</script>
<Plot {data} responsive height={380}>
  <Pie bind:this={pie} value="sales" category="region" sectorLabel="percent" hover respond="hovered" />
  <Legend for={pie} channel="fill" label="Region" position="right" />
</Plot>