Earthquakes from a Parquet file
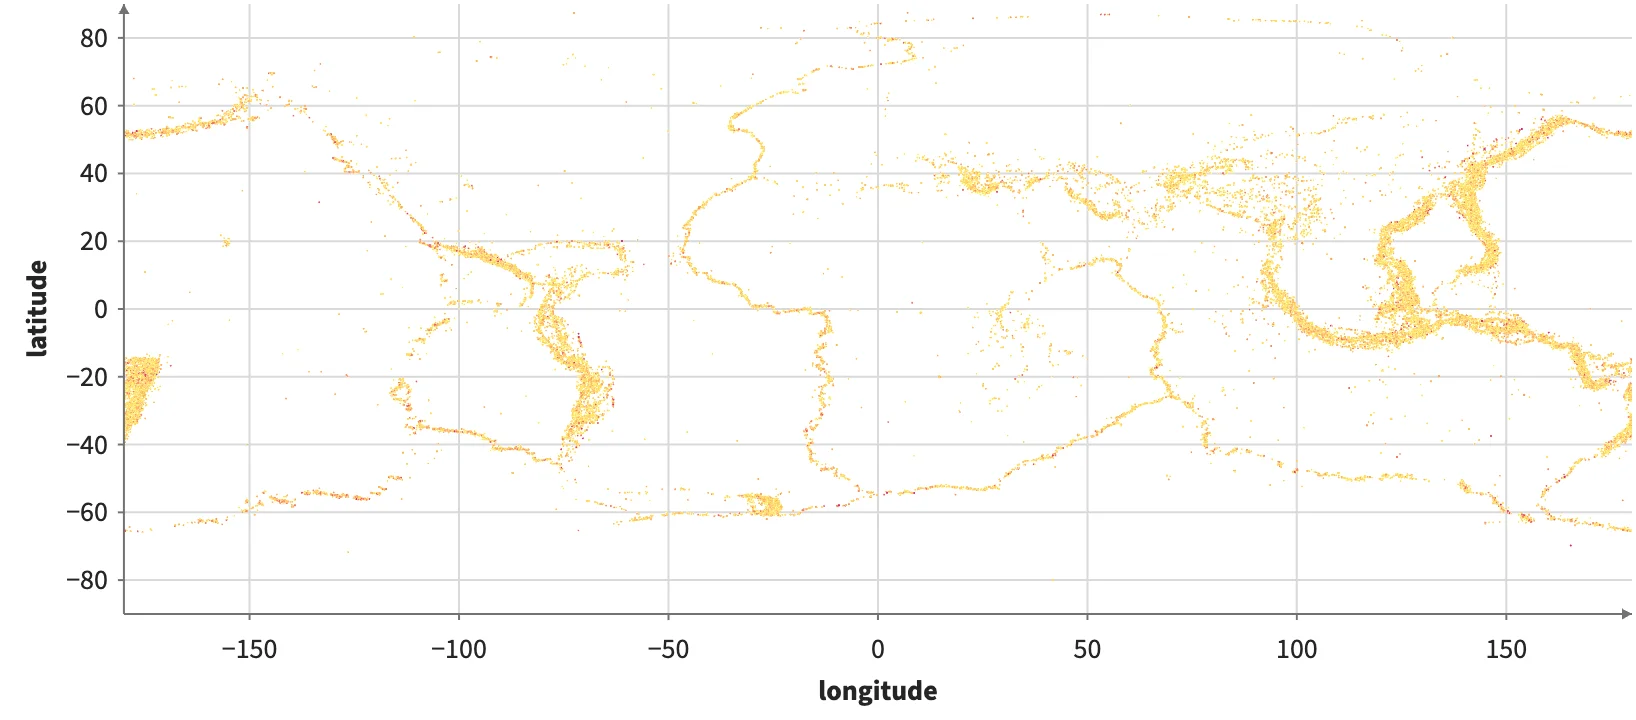
A Provider reads three of a Parquet file's five columns (ten years of USGS earthquakes, magnitude 4.5+) with HTTP range requests; the other two are never downloaded. Python reads the same columns with hm.Table.from_parquet.
Static preview; loading the interactive plot
<script>
  import { Provider, Plot, Points, continuous } from "hmplot";
  const magnitudeColors = continuous({ domain: [4.5, 8], colormap: ["#ffe066", "#e0245e", "#4361ee"] });
</script>
<!-- Only lon, lat and mag are read from the file, by HTTP range requests. -->
<Provider url="/data/earthquakes/usgs-m45-2015-2024.parquet" format="parquet" columns={["lon", "lat", "mag"]}>
  <Plot height={360} axes2d x={{ domain: [-180, 180] }} y={{ domain: [-90, 90] }}>
    <Points x="lon" y="lat" fill="mag" fillScale={magnitudeColors} size={1} />
  </Plot>
</Provider>