Parallel coordinates from connections
An embedded Facet with fields makes one cell per measurement, in which value is that measurement, each with its own y scale titled by the measurement, and a Frame in every cell sets x from 0 to 1, so the points sit on each cell's axis. One Line connects the points across the cells in facet order, and every cell shows the same penguins, so rows match without a key. Shift-drag on any axis to brush that measurement; brushes on several axes combine.
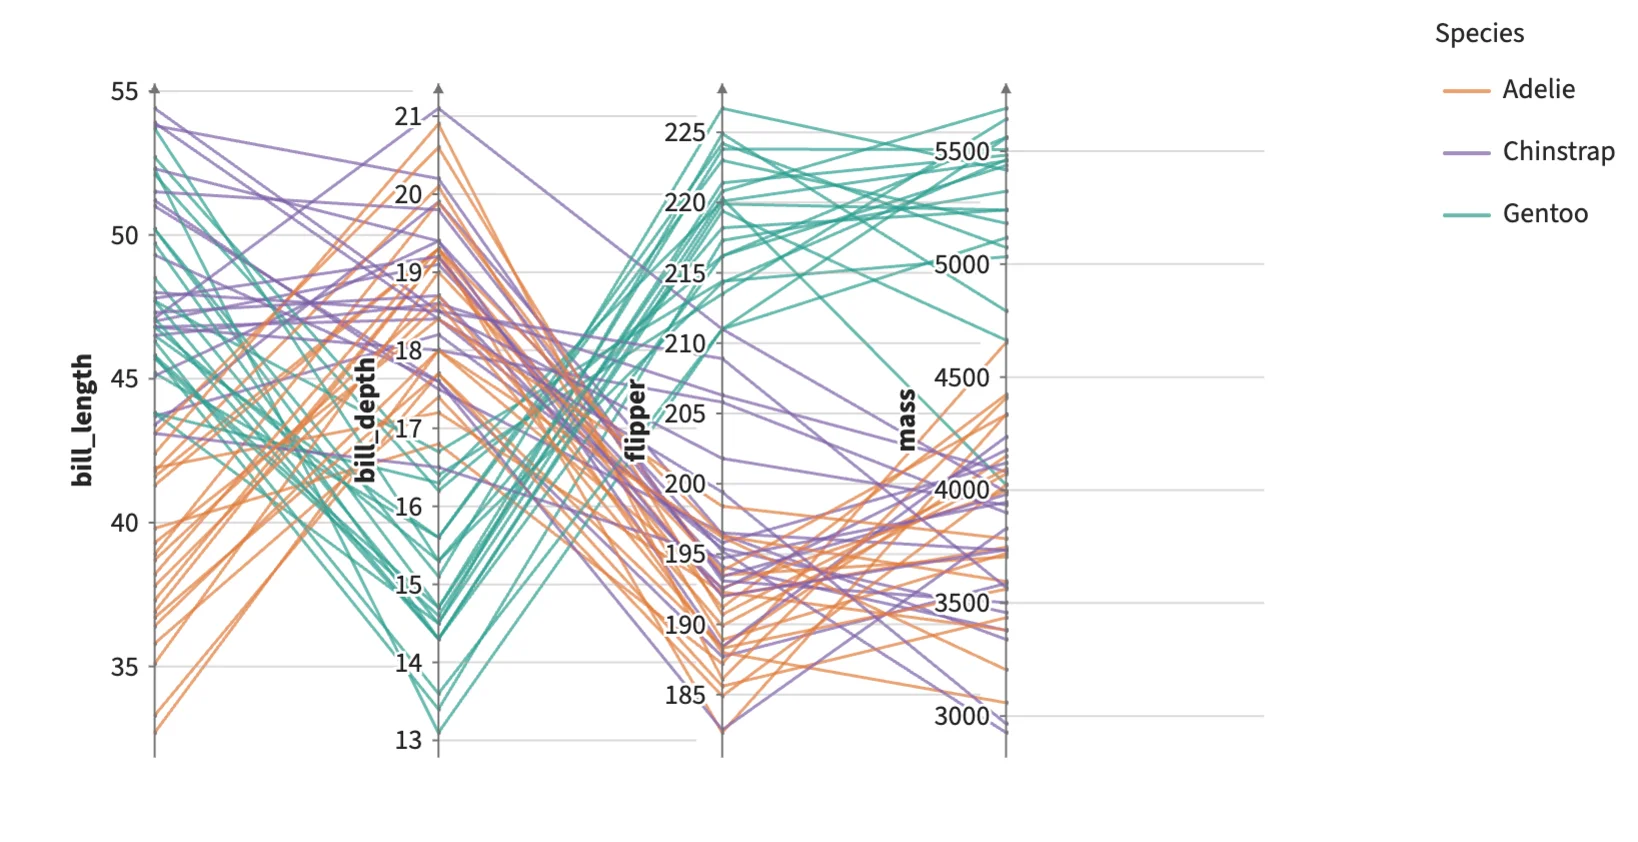
Static preview; loading the interactive plot
<script>
  import { Plot, Frame, Facet, Points, Line, Legend, connect, categorical } from "hmplot";
  // penguins: one row per penguin with id, species, bill_length, bill_depth, flipper, mass.
  let facet = $state(), lines = $state();
  const colors = categorical({ domain: ["Adelie", "Chinstrap", "Gentoo"], range: ["#e07b39", "#7b5ea7", "#2a9d8f"] });
</script>
<Plot data={penguins} responsive height={420} axes2d={false}>
  <Facet bind:this={facet} fields={["bill_length", "bill_depth", "flipper", "mass"]}>
    <!-- x runs from 0 to 1 across the cell (hidden); y is the cell's measurement. -->
    <Frame x={{ domain: [0, 1], visible: false }}>
      <Points name="values" x={0} y="value" size={2.5} fill="#5d6773" brush={{ axis: "y" }} />
    </Frame>
  </Facet>
  <Line bind:this={lines} connections={connect(facet?.endpoint("values"))}
    color="species" colorScale={colors} width={1.5} opacity={0.7} respond="brushed" />
  <Legend for={lines} channel="color" label="Species" position="right" />
</Plot>