Nearby points
Move the pointer over the clusters: every row within the radius grows, including all overplotted rows at a cluster center, and the rest shrink. Adjust the radius with the slider.
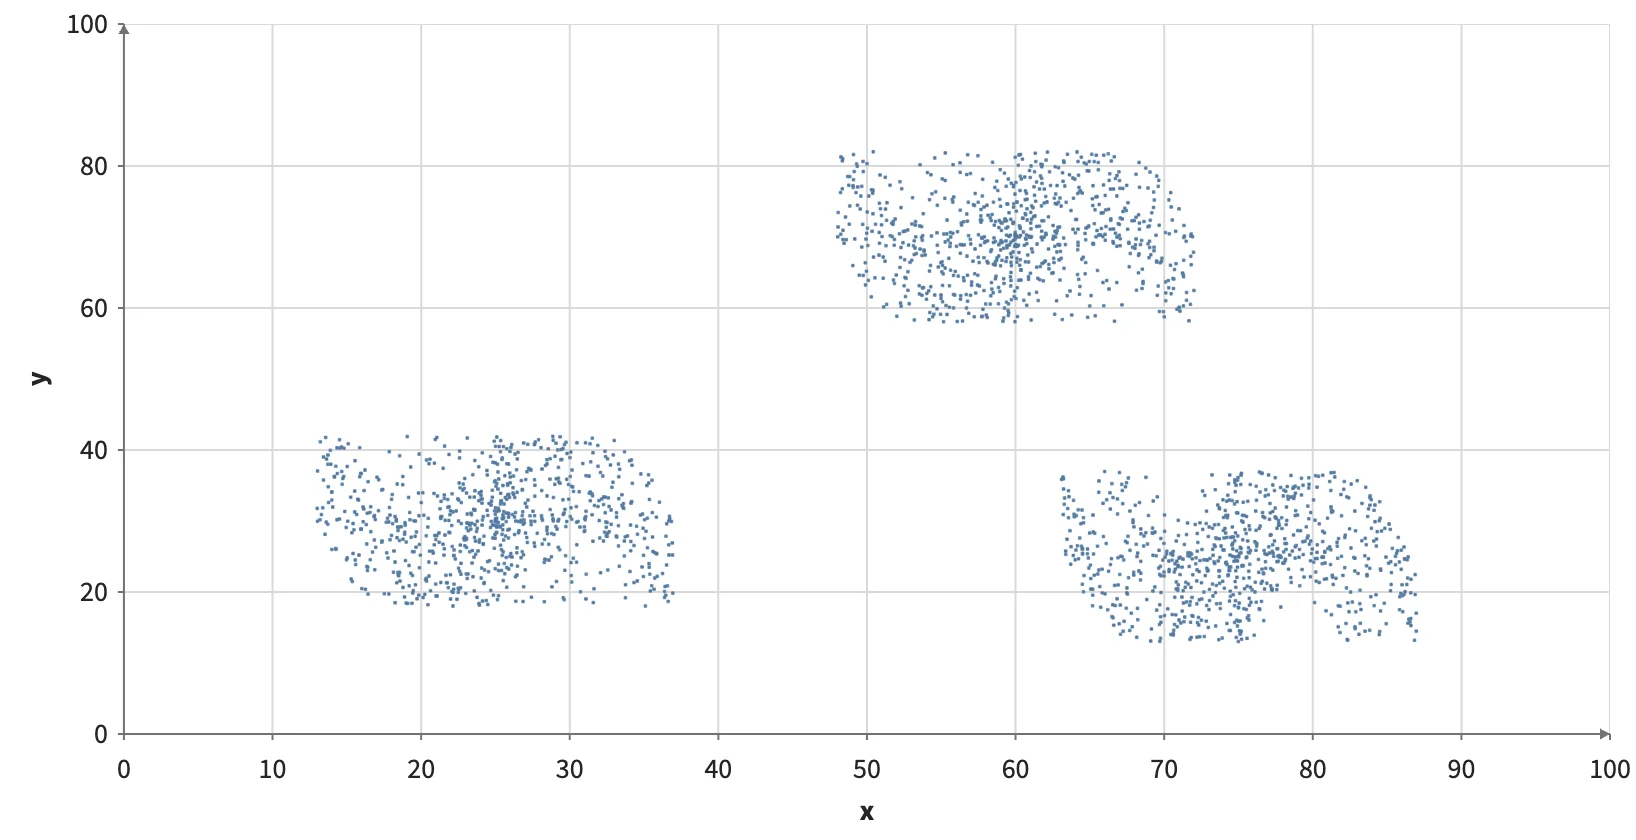
Static preview; loading the interactive plot
<script>
  import { Plot, Points, where } from "hmplot";
  let radius = $state(24);
  // Dense clusters with many exactly overplotted rows, so hover alone would reach only one of them.
  const count = 3000;
  const centers = [[25, 30], [60, 70], [75, 25]];
  const data = {
    x: Array.from({length: count}, (_, i) => { const c = centers[i % 3]; return i % 5 === 0 ? c[0] : c[0] + 12 * Math.sin(i * 1.7) * Math.cos(i * 0.31); }),
    y: Array.from({length: count}, (_, i) => { const c = centers[i % 3]; return i % 5 === 0 ? c[1] : c[1] + 12 * Math.cos(i * 1.3) * Math.sin(i * 0.53); }),
  };
</script>
<label class="controls">Radius <input type="range" min="6" max="80" bind:value={radius} /> {radius} px</label>
<Plot data={data} responsive height={420} axes2d x={{domain: [0, 100]}} y={{domain: [0, 100]}}>
  <Points x="x" y="y" nearby={{radius}} fill="#547ba2"
    size={where("@any_nearby", where("@nearby", 5, 1), 2)} />
</Plot>