Nearby along x
Single-axis nearby in data units picks every series at the day under the pointer, whatever the pointer's height, and labels them.
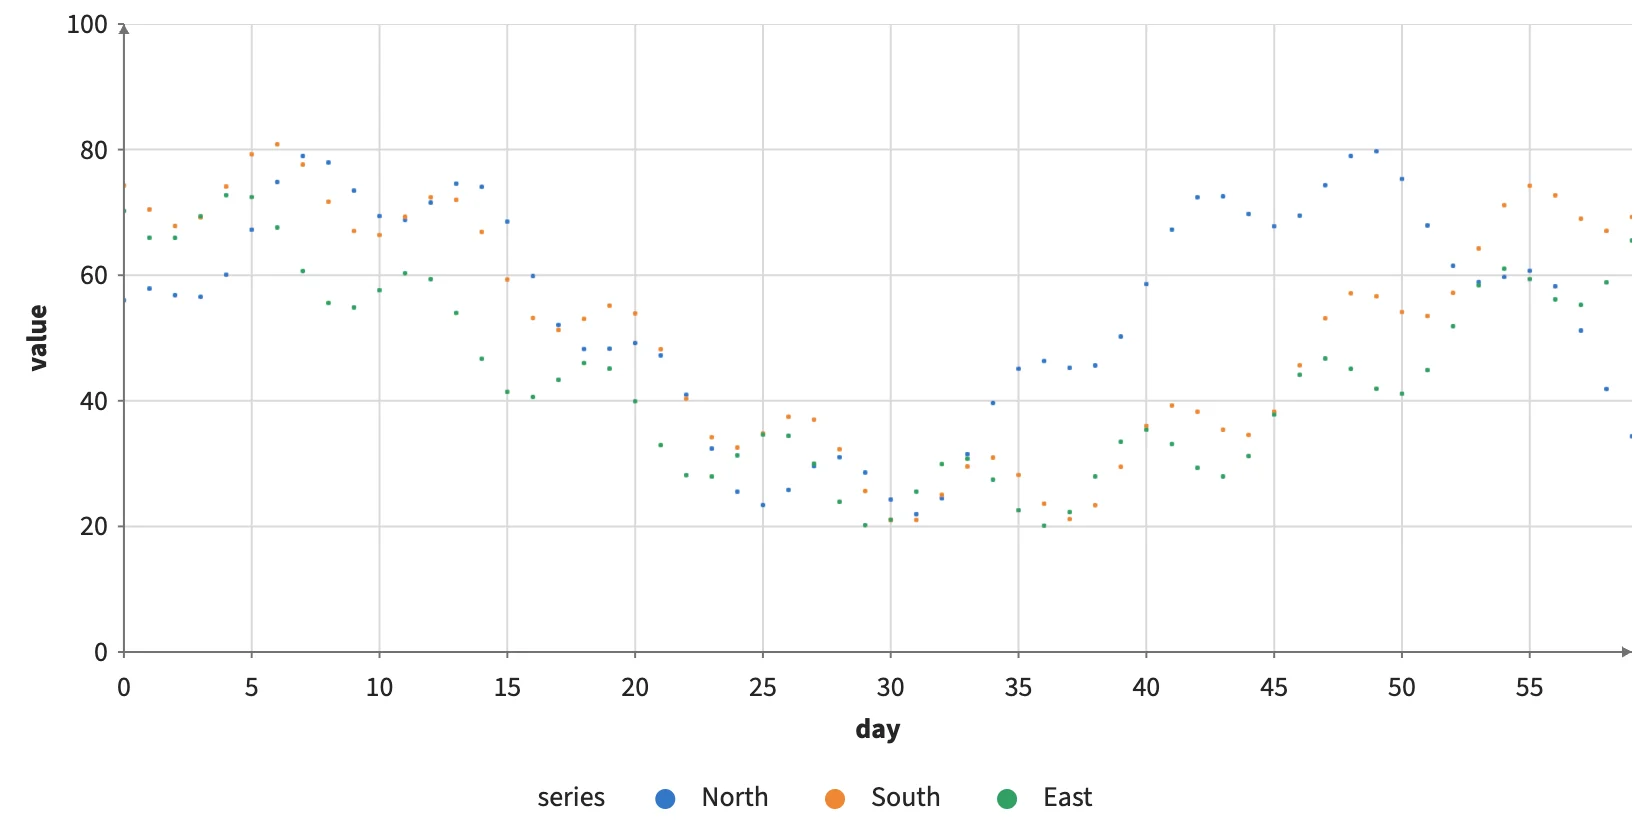
Static preview; loading the interactive plot
<script>
  import { Plot, Points, Filter, Text, where } from "hmplot";
  // Three series sampled at the same integer days, in long format.
  const days = 60, series = ["North", "South", "East"];
  const rows = series.flatMap((name, s) => Array.from({length: days}, (_, t) => ({
    day: t, series: name, value: 50 + 25 * Math.sin(t / (6 + 3 * s) + s) + 6 * Math.cos(t * 0.9 + s),
  })));
  const data = {
    day: rows.map((row) => row.day), series: rows.map((row) => row.series),
    value: rows.map((row) => row.value), label: rows.map((row) => `${row.series} ${row.value.toFixed(1)}`),
  };
</script>
<Plot data={data} responsive height={420} axes2d x={{domain: [0, days - 1]}} y={{domain: [0, 100]}}>
  <Points x="day" y="value" fill="series" nearby={{axis: "x", units: "data", radius: 0.5}}
    size={where("@nearby", 6, 2.5)} />
  <Filter where="@nearby" inactive="none">
    <Text x="day" y="value" text="label" size={11} dy={-14} />
  </Filter>
</Plot>