Mona Lisa histogram
Every pixel of the painting is a data-space square with RGB fill, and an RGB histogram sits over its lower part, its three channels screen-blended so overlaps add up to white as in the D3 notebook. Brush a region and the histogram counts only those pixels. After the D3 notebook of the same name.
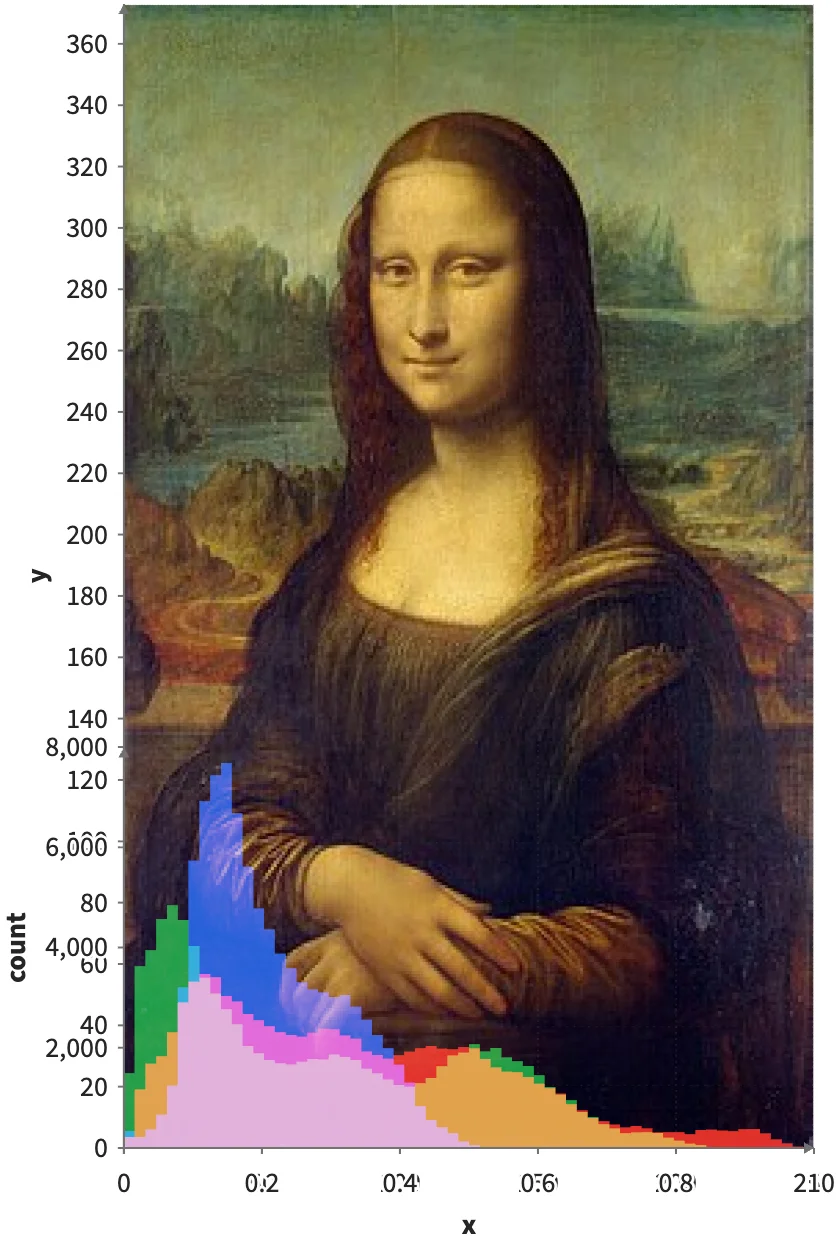
Static preview; loading the interactive plot
<script>
  import { onMount } from "svelte";
  import { Data, Plot, Frame, Points, Rect } from "hmplot";
import { Bin } from "hmplot/stats";
  let { onready = () => {} } = $props();
  let plot = $state(), pixels = $state.raw(), size = $state([250, 373]), error = $state("");
  const abort = new AbortController();
  const width = 420, height = $derived(Math.round(width * size[1] / size[0]));
  // 64 fixed bins over 0-1 keep the axis still while the brush changes.
  const edges = Array.from({ length: 65 }, (_, i) => i / 64);
  const channels = [["r", "#e0301e"], ["g", "#1a9e3f"], ["b", "#2360d8"]];

  onMount(() => {
    (async () => {
      const response = await fetch("/examples/mona-lisa/mona-lisa.jpg", { signal: abort.signal });
      if (!response.ok) throw Error(`Could not load the image (${response.status}).`);
      const bitmap = await createImageBitmap(await response.blob());
      const { width: w, height: h } = bitmap;
      // One-time decoding: one row per pixel, with its position and 0-1 channel values.
      const context = new OffscreenCanvas(w, h).getContext("2d", { willReadFrequently: true });
      context.drawImage(bitmap, 0, 0);
      bitmap.close();
      const data = context.getImageData(0, 0, w, h).data, n = w * h;
      const table = { x: new Float32Array(n), y: new Float32Array(n), r: new Float32Array(n), g: new Float32Array(n), b: new Float32Array(n) };
      for (let i = 0; i < n; i++) {
        table.x[i] = i % w;
        table.y[i] = h - 1 - Math.floor(i / w); // image rows run top-down
        table.r[i] = data[i * 4] / 255; table.g[i] = data[i * 4 + 1] / 255; table.b[i] = data[i * 4 + 2] / 255;
      }
      abort.signal.throwIfAborted();
      size = [w, h];
      pixels = table;
    })().catch((e) => { if (!abort.signal.aborted) error = e.message; });
    return () => abort.abort();
  });
  $effect(() => onready(plot));
</script>

{#if error}<p role="alert">{error}</p>{/if}
{#if pixels}
  <Data value={pixels}>
    <Plot bind:this={plot} {width} {height} toneMapping={0} x={{ domain: [0, size[0]] }} y={{ domain: [0, size[1]] }} z={{ domain: [-1, 1] }}>
      <!-- Size-1 squares in data units tile like pixels at any zoom. -->
      <Points x="x" y="y" fill={{ r: "r", g: "g", b: "b" }} shape="square" size={1.6} sizeUnits="data" brush respond={false} />
      <Frame x={{ domain: [0, 1], range: [0, size[0]] }} y={{ range: [0, size[1] * 0.35] }}>
        <!-- weight="@brushed" counts brushed pixels (every pixel with no brush) without
             refiltering, so brushing reuses the same compiled GPU kernels. -->
        {#each channels as [column, color]}
          <Bin x={column} bins={edges} weight="@brushed">
            <Rect x0="x0" x1="x1" y0={0} y1="count" fill={color} blend="screen" />
          </Bin>
        {/each}
      </Frame>
    </Plot>
  </Data>
{/if}