Market hours: an axis that skips weekends and nights
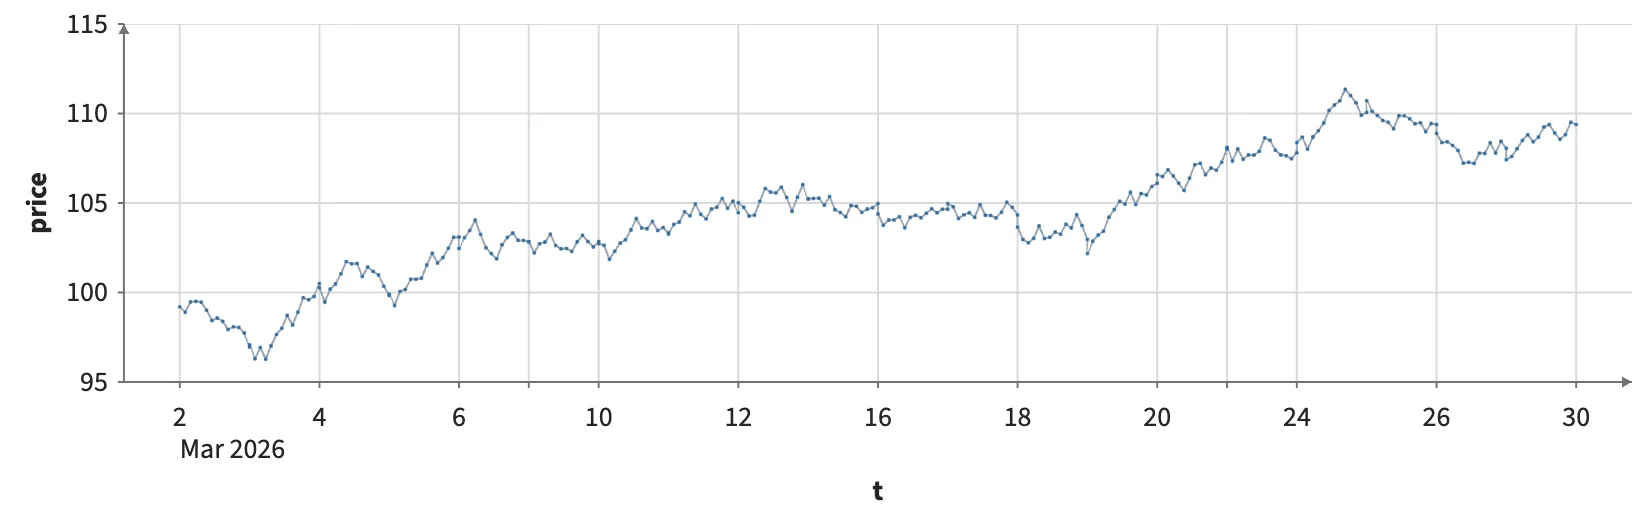
Half-hourly prices on an axis that leaves out weekends and the hours outside a 09:30 to 16:00 session in New York; the line runs on from each close to the next open, and a brush can span a break.
Static preview; loading the interactive plot
<Plot {data} axes2d x={{ timezone: "America/New_York", breaks: ["weekends", { hours: [16, 9.5] }] }}>
  <Line x="t" y="price" />
  <Points x="t" y="price" size={2} brush respond="brushed" />
</Plot>