Lollipop chart
A stem from the baseline to each value, on either side of it, with a point at the end. Lollipop is a built-in template: BarGeometry places each stem, Segments draws the stems and Points the heads.
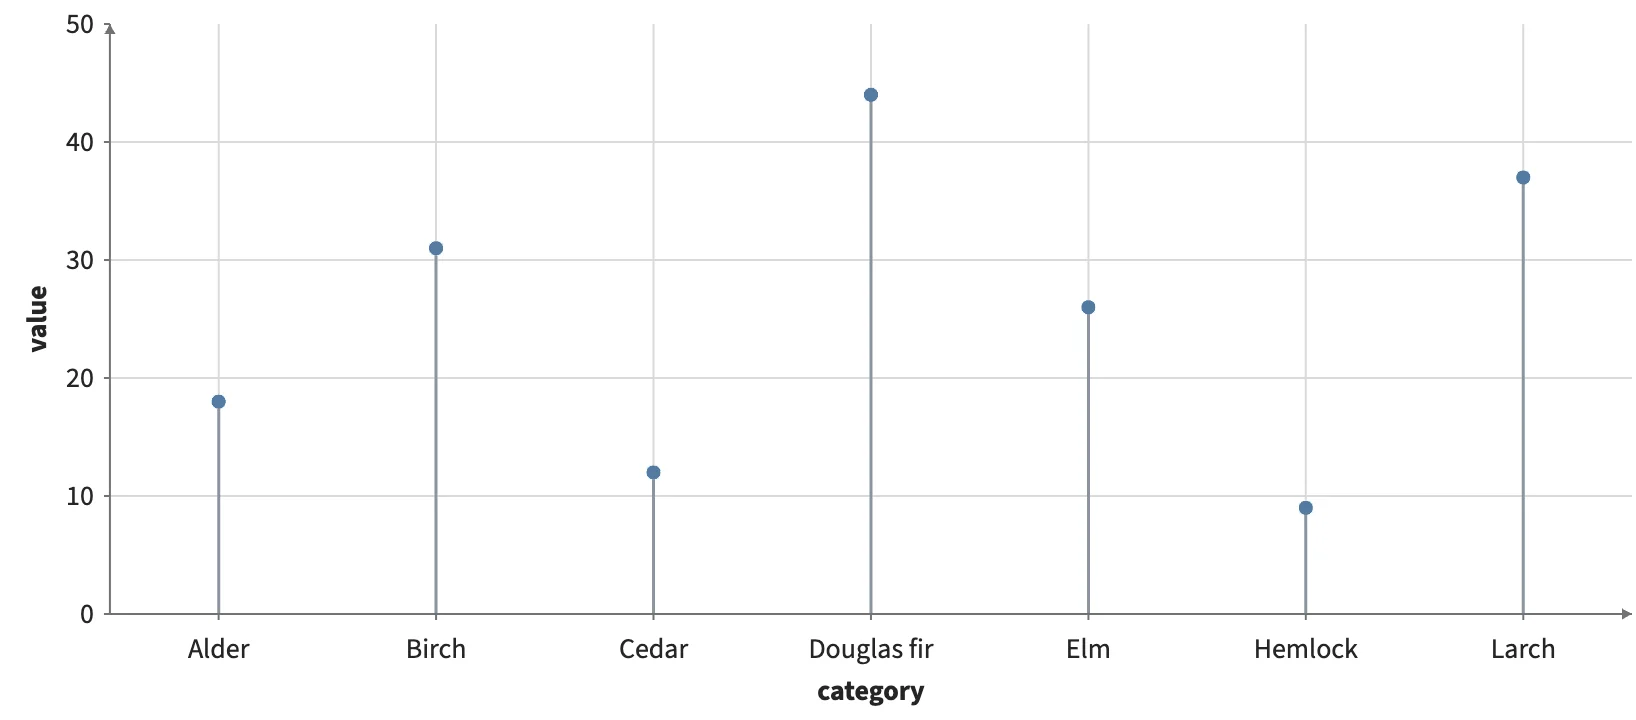
Static preview; loading the interactive plot
<script>
  import { Plot } from "hmplot";
import { Lollipop } from "hmplot/charts";
  const data = {
    category: ["Alder", "Birch", "Cedar", "Douglas fir", "Elm", "Hemlock", "Larch"],
    value: [18, 31, 12, 44, 26, 9, 37],
  };
</script>
<Plot data={data} responsive height={360} axes2d y={{ domain: [0, 50] }}>
  <Lollipop x="category" y="value" fill="#547ba2" size={7} />
</Plot>