Legend channels
Colored symbols when one column drives fill and shape, a size ramp for a numeric column, and one legend for a facet grid that hides a species in every cell.
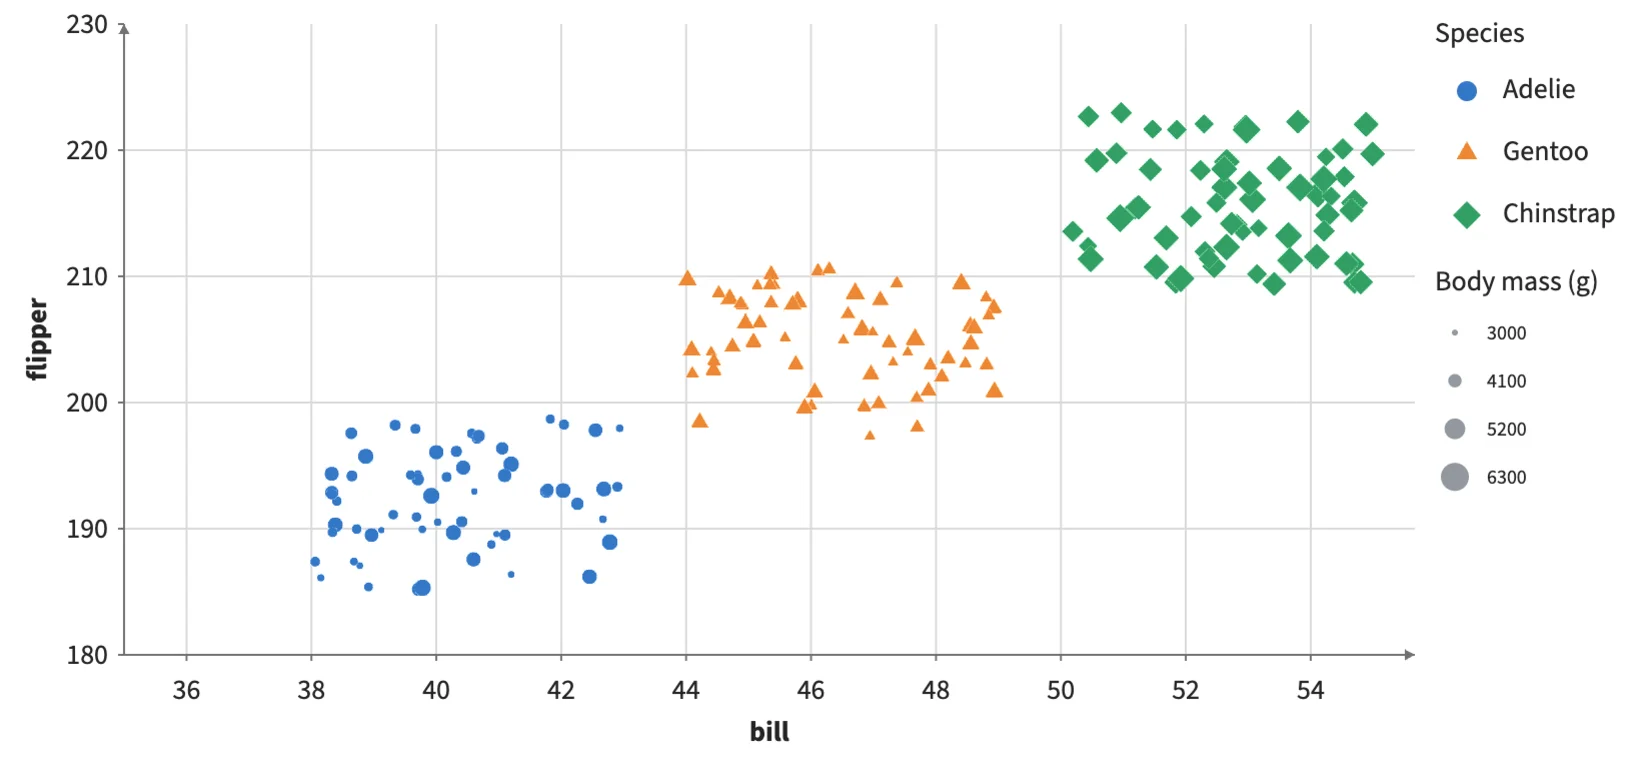
Static preview; loading the interactive plot
<script>
  import { Plot, Facet, Points, Legend, continuous } from "hmplot";
  let points = $state();
  // Deterministic pseudo-random measurements for three species on three islands.
  const noise = (i, k) => { const v = Math.sin(i * 12.9898 + k * 78.233) * 43758.5453; return v - Math.floor(v); };
  const species = ["Adelie", "Gentoo", "Chinstrap"], islands = ["Biscoe", "Dream", "Torgersen"];
  const rows = Array.from({ length: 180 }, (_, i) => {
    const s = i % 3;
    return { species: species[s], island: islands[Math.floor(noise(i, 5) * 3)],
      bill: 38 + 6 * s + 5 * noise(i, 1), flipper: 185 + 12 * s + 14 * noise(i, 2),
      mass: 3000 + 900 * s + 1500 * noise(i, 3) };
  });
  const data = Object.fromEntries(Object.keys(rows[0]).map((key) => [key, rows.map((row) => row[key])]));
  const mass = continuous({ domain: [3000, 6300], range: [3, 14] });
</script>
<Plot data={data} responsive height={380} axes2d>
  <Points bind:this={points} x="bill" y="flipper" fill="species" shape="species" size="mass" sizeScale={mass} />
  <Legend for={points} channel="fill" label="Species" position="right" />
  <Legend for={points} channel="size" label="Body mass (g)" position="right" />
</Plot>
<Facet data={data} column="island">
  <Plot height={220} axes2d>
    <Points x="bill" y="flipper" fill="species" size="mass" sizeScale={mass} />
    <Legend channel="fill" label="Species" position="bottom" />
  </Plot>
</Facet>