A Hovmöller diagram
Slice at one latitude of a time x latitude x longitude grid table leaves time against longitude: an anomaly travelling east is diagonal banding. The latitude is a slider.
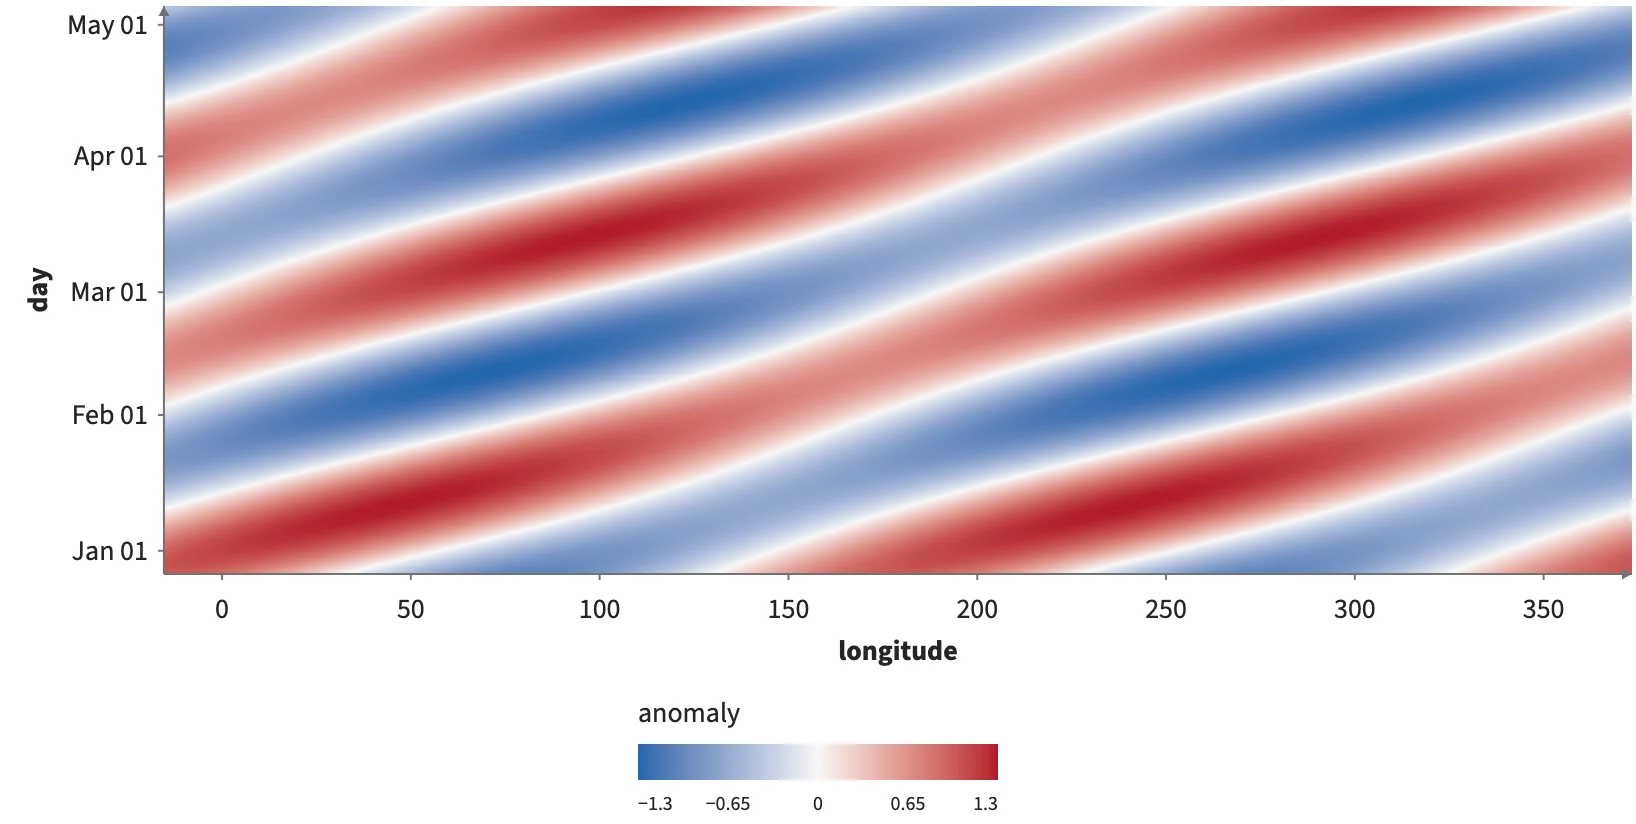
Static preview; loading the interactive plot
<InputContext>
  <Data value={gridTable({ dims: { time, lat, lon }, columns: { anomaly } })}>
    <Slider name="latitude" min={-30} max={30} step={0.5} value={0} label="Latitude" />
    <Slice field="lat" at={input("latitude")}>
      <Plot responsive height={420} axes2d legend>
        <Heatmap fill="anomaly" fillScale={anomalies} />
      </Plot>
    </Slice>
  </Data>
</InputContext>