Half a million points, one slider
A slider filters 500,000 points by magnitude into a 3D hexbin and a histogram. A Filter that keeps under a quarter of a large input packs the kept rows into a few fixed lengths, so the work after it follows the selection and each length compiles once.
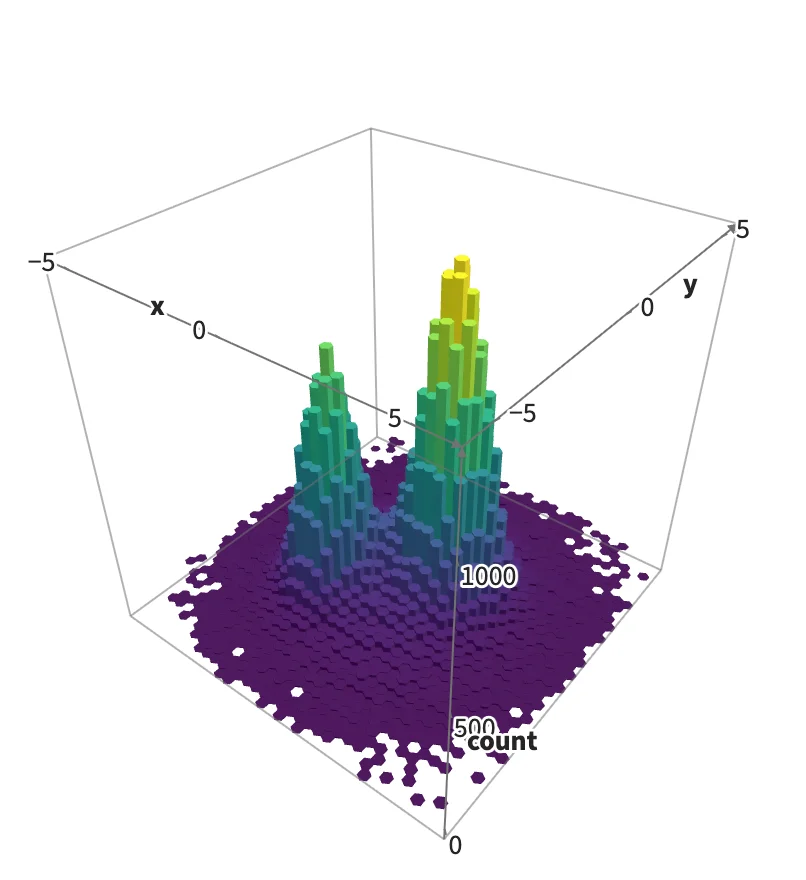
Static preview; loading the interactive plot
<script>
  import { T } from "@threlte/core";
  import { Data, Plot, Filter, Prism, Rect } from "hmplot";
import { Hexbin, Bin } from "hmplot/stats";
  // table: 500,000 rows with x, y and magnitude.
  let minimum = $state(2);
</script>
<input type="range" min="0.5" max="6" step="0.01" bind:value={minimum} />
<Data value={table}>
  <Plot x={{ domain: [-6, 6] }} y={{ domain: [-6, 6] }} type="3d" axes3d
    cameraPosition={[110, -140, 130]} cameraUp={[0, 0, 1]}>
    <T.AmbientLight intensity={1.5} /><T.DirectionalLight position={[40, 80, 100]} intensity={3} />
    <Filter where={{ field: "magnitude", op: "gt", value: minimum }}>
      <Hexbin x="x" y="y" bins={36} bounds={{ x: [-6, 6], y: [-6, 6] }}>
        <Prism x="x" y="y" width="width" depth="depth" z0={0} z1="count"
          shape="hexagon" rotation="rotation" fill="count" lit={true} />
      </Hexbin>
    </Filter>
  </Plot>
  <Plot axes2d>
    <Filter where={{ field: "magnitude", op: "gt", value: minimum }}>
      <Bin x="magnitude" bins={40}><Rect x0="x0" x1="x1" y0={0} y1="count" /></Bin>
    </Filter>
  </Plot>
</Data>