A gridded field on the globe, month by month
A grid table (month x latitude x longitude, one row per cell) holds a made-up surface temperature on 48 uneven latitudes. Slice through time blends the two months around a Playback's value on the GPU; the Heatmap places the latitudes by their coordinates.
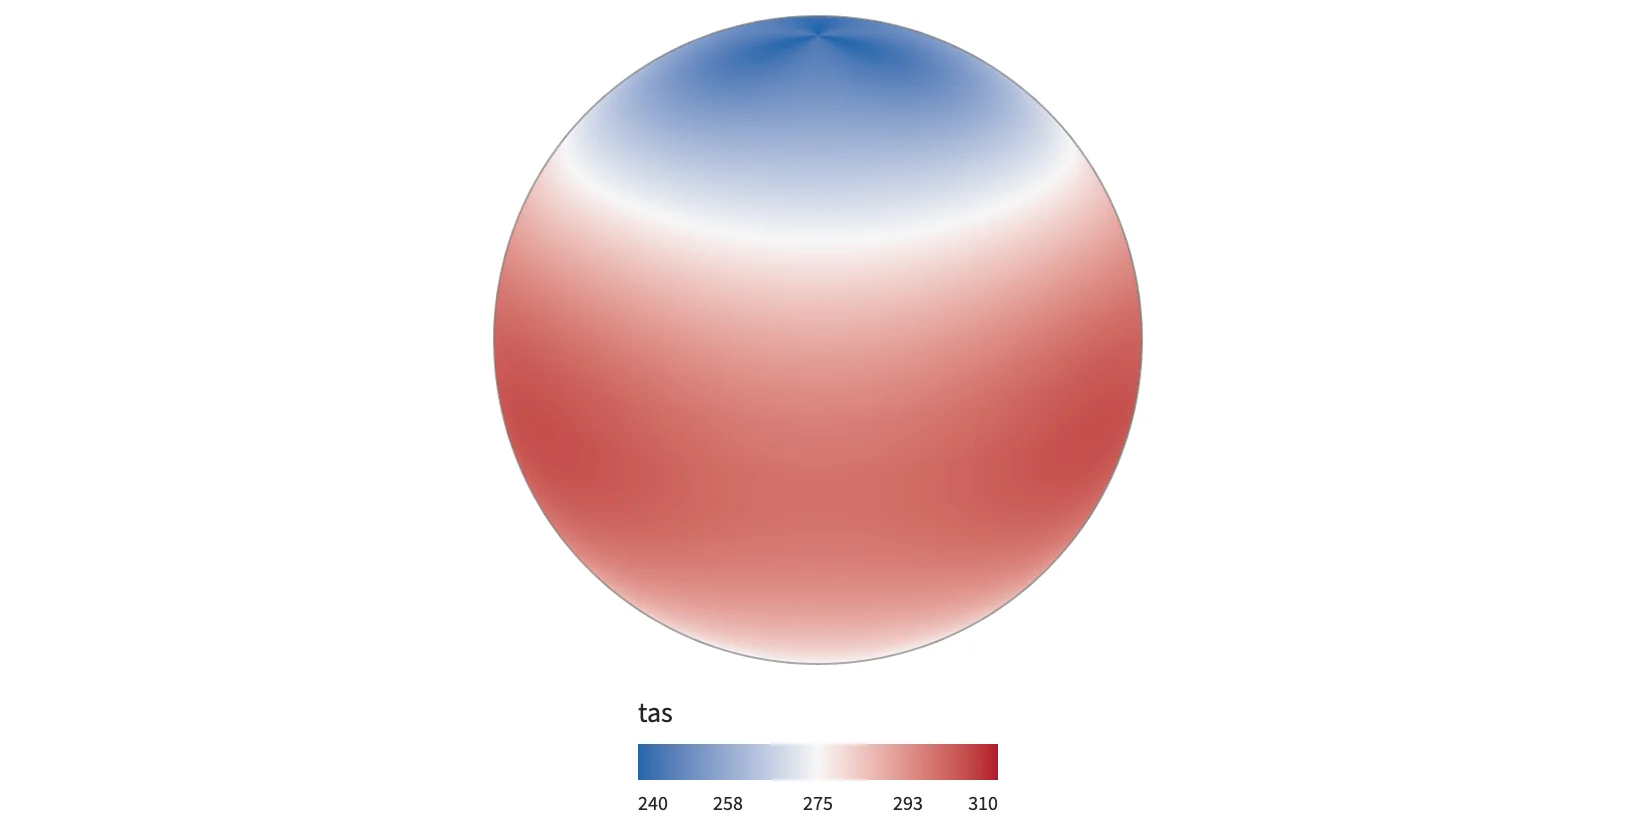
Static preview; loading the interactive plot
<script>
  import { Data, InputContext, Playback, Plot, Slice, Heatmap, gridTable, continuous, input, min, max } from "hmplot";
  // tas: one value per (month, latitude, longitude) cell, in that order.
  const field = gridTable({ dims: { time, lat, lon }, columns: { tas } });
  const temperature = continuous({ colormap: ["#2166ac", "#f7f7f7", "#b2182b"], domain: [240, 310] });
</script>

<InputContext>
  <Data value={field}>
    <Playback name="month" min={min("time")} max={max("time")} rate={2} loop label="Month" />
    <Slice field="time" at={input("month")}>
      <Plot responsive height={420} coordinates="spherical" projection="orthographic"
        x={{ domain: [-180, 180] }} y={{ domain: [-90, 90] }} legend>
        <Heatmap fill="tas" fillScale={temperature} tooltip />
      </Plot>
    </Slice>
  </Data>
</InputContext>