Marks in nested frames
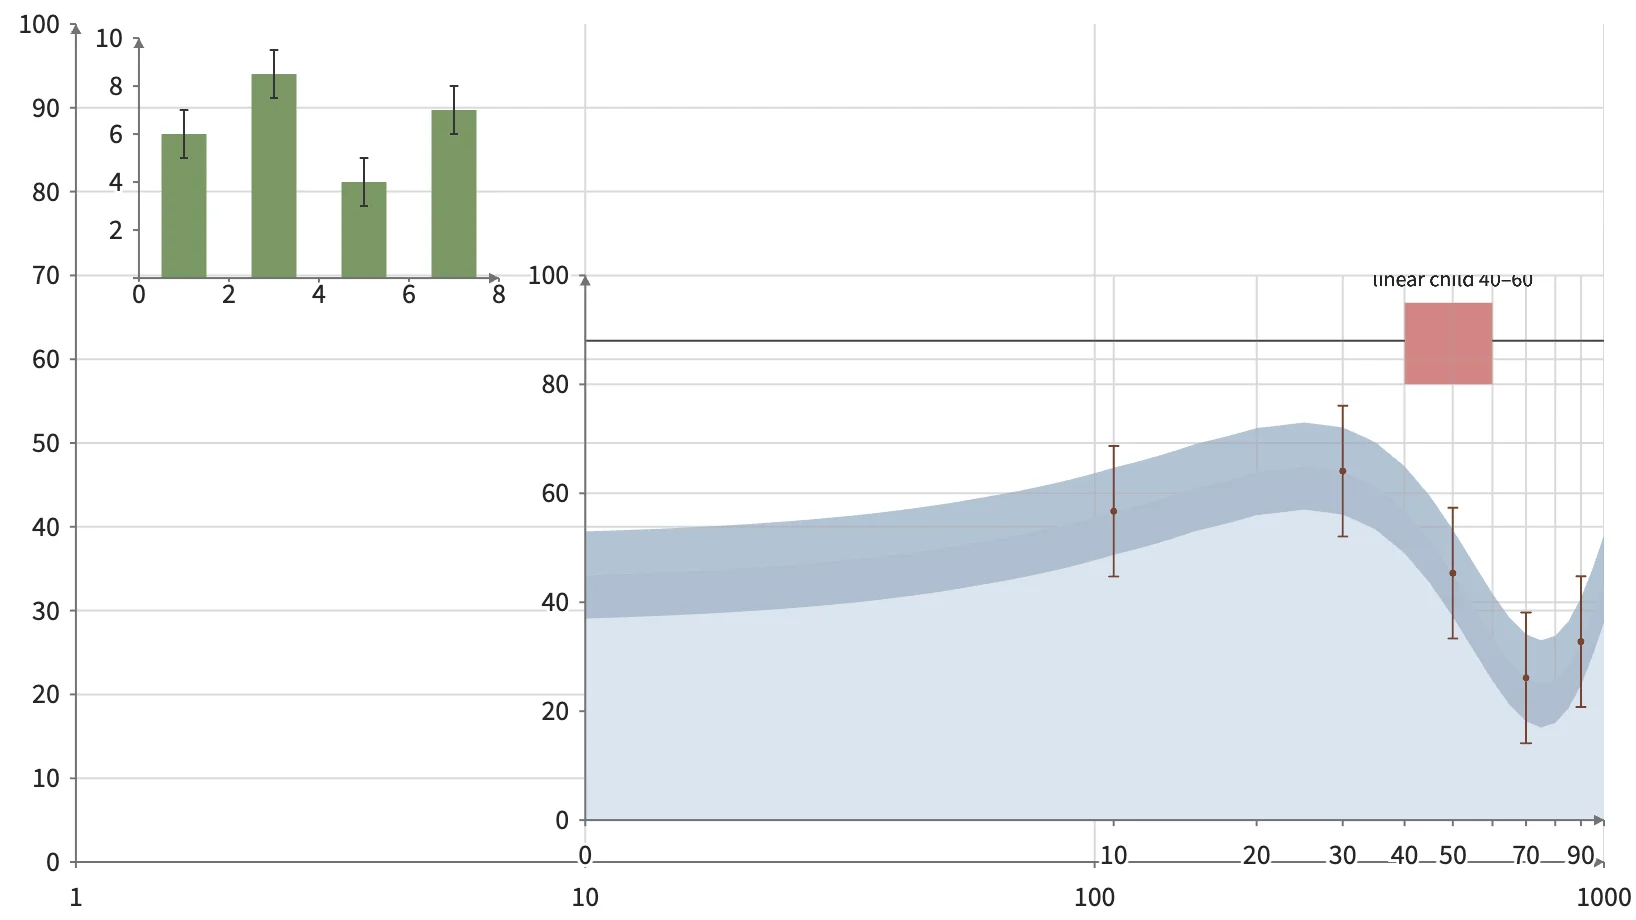
Area, ErrorBars, Rect, and curved Segments inside a linear child of a log parent, and bars with error bars in an anchored inset that keeps its pixel size while you pan and zoom.
Static preview; loading the interactive plot
<script>
  import { Plot, Frame, Area, Rect, Segments, Points, Text } from "hmplot";
import { ErrorBars } from "hmplot/charts";
  const t = Array.from({length: 21}, (_, i) => i * 5);
  const signal = t.map((v) => 45 + 20 * Math.sin(v / 16));
  const band = { t, signal, lower: signal.map((v) => v - 8), upper: signal.map((v) => v + 8) };
  const samples = { t: t.filter((_, i) => i % 4 === 2), y: signal.filter((_, i) => i % 4 === 2) };
  samples.lower = samples.y.map((v) => v - 12); samples.upper = samples.y.map((v) => v + 12);
  const bars = { x0: [0.5, 2.5, 4.5, 6.5], x1: [1.5, 3.5, 5.5, 7.5], y0: [0, 0, 0, 0], y1: [6, 8.5, 4, 7] };
</script>
<Plot responsive height={460} axes2d x={{domain: [1, 1000], transform: "log"}} y={{domain: [0, 100]}}>
  <Frame x={{domain: [0, 100], range: [10, 1000]}} y={{domain: [0, 100], range: [5, 70]}}>
    <Area x={t} upper={signal} lower={0} fill="#dbe4ee" />
    <Area x={t} lower={band.lower} upper={band.upper} fill="#547ba2" opacity={0.45} />
    <ErrorBars x={samples.t} y={samples.y} lower={samples.lower} upper={samples.upper} color="#754331" capSize={5} />
    <Points x={samples.t} y={samples.y} fill="#754331" size={3.5} />
    <Rect x0={[40]} x1={[60]} y0={[80]} y1={[95]} fill="#c0504d" opacity={0.7} />
    <Segments start={[[0, 88], [100, 88]]} end={[[40, 88], [60, 88]]} color="#444444" />
    <Text position={[[50, 99]]} text={["linear child 40–60"]} size={11} />
  </Frame>
  <!-- A child that sets its own domain is linear; it does not inherit the parent's log x scale. -->
  <Frame placement={{anchor: [3, 84], size: [180, 120]}} x={{domain: [0, 8]}} y={{domain: [0, 10]}}>
    <Rect x0={bars.x0} x1={bars.x1} y0={bars.y0} y1={bars.y1} fill="#7b9865" />
    <ErrorBars position={[[1, 6], [3, 8.5], [5, 4], [7, 7]]} lower={[5, 7.5, 3, 6]} upper={[7, 9.5, 5, 8]} color="#333333" capSize={4} />
  </Frame>
</Plot>