One cell per variable
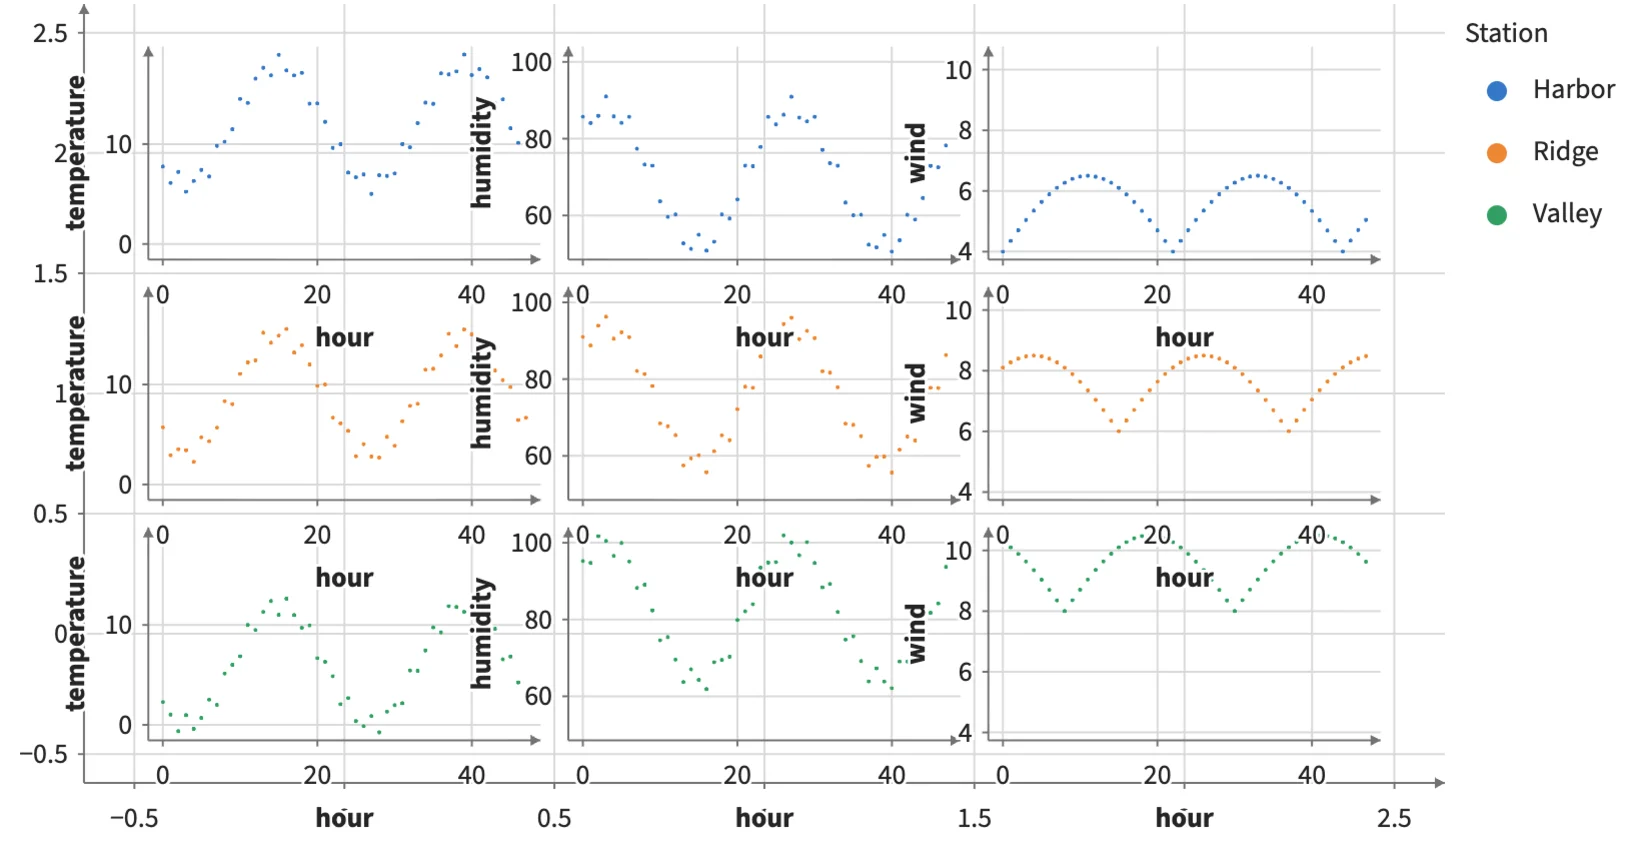
Facet fields repeats its children once per field over the same rows; inside each cell, value is that field. Each field keeps its own y scale while columns of the table stay shared. With row="station" the fields form a grid by station, a field keeping one scale down its column.
Static preview; loading the interactive plot
<Plot data={weather} height={260} axes2d>
  <Facet fields={["temperature", "humidity", "wind"]}>
    <Line x="hour" y="value" color="station" width={1.5} />
  </Facet>
</Plot>
<Plot data={weather} height={420} axes2d>
  <Facet fields={["temperature", "humidity", "wind"]} row="station">
    <Points x="hour" y="value" fill="station" size={2} />
  </Facet>
</Plot>