Expandable tree
Collapse branches and filter by depth while GPU subtree widths and unequal edge lengths animate. Paired Svelte and Python scenes.
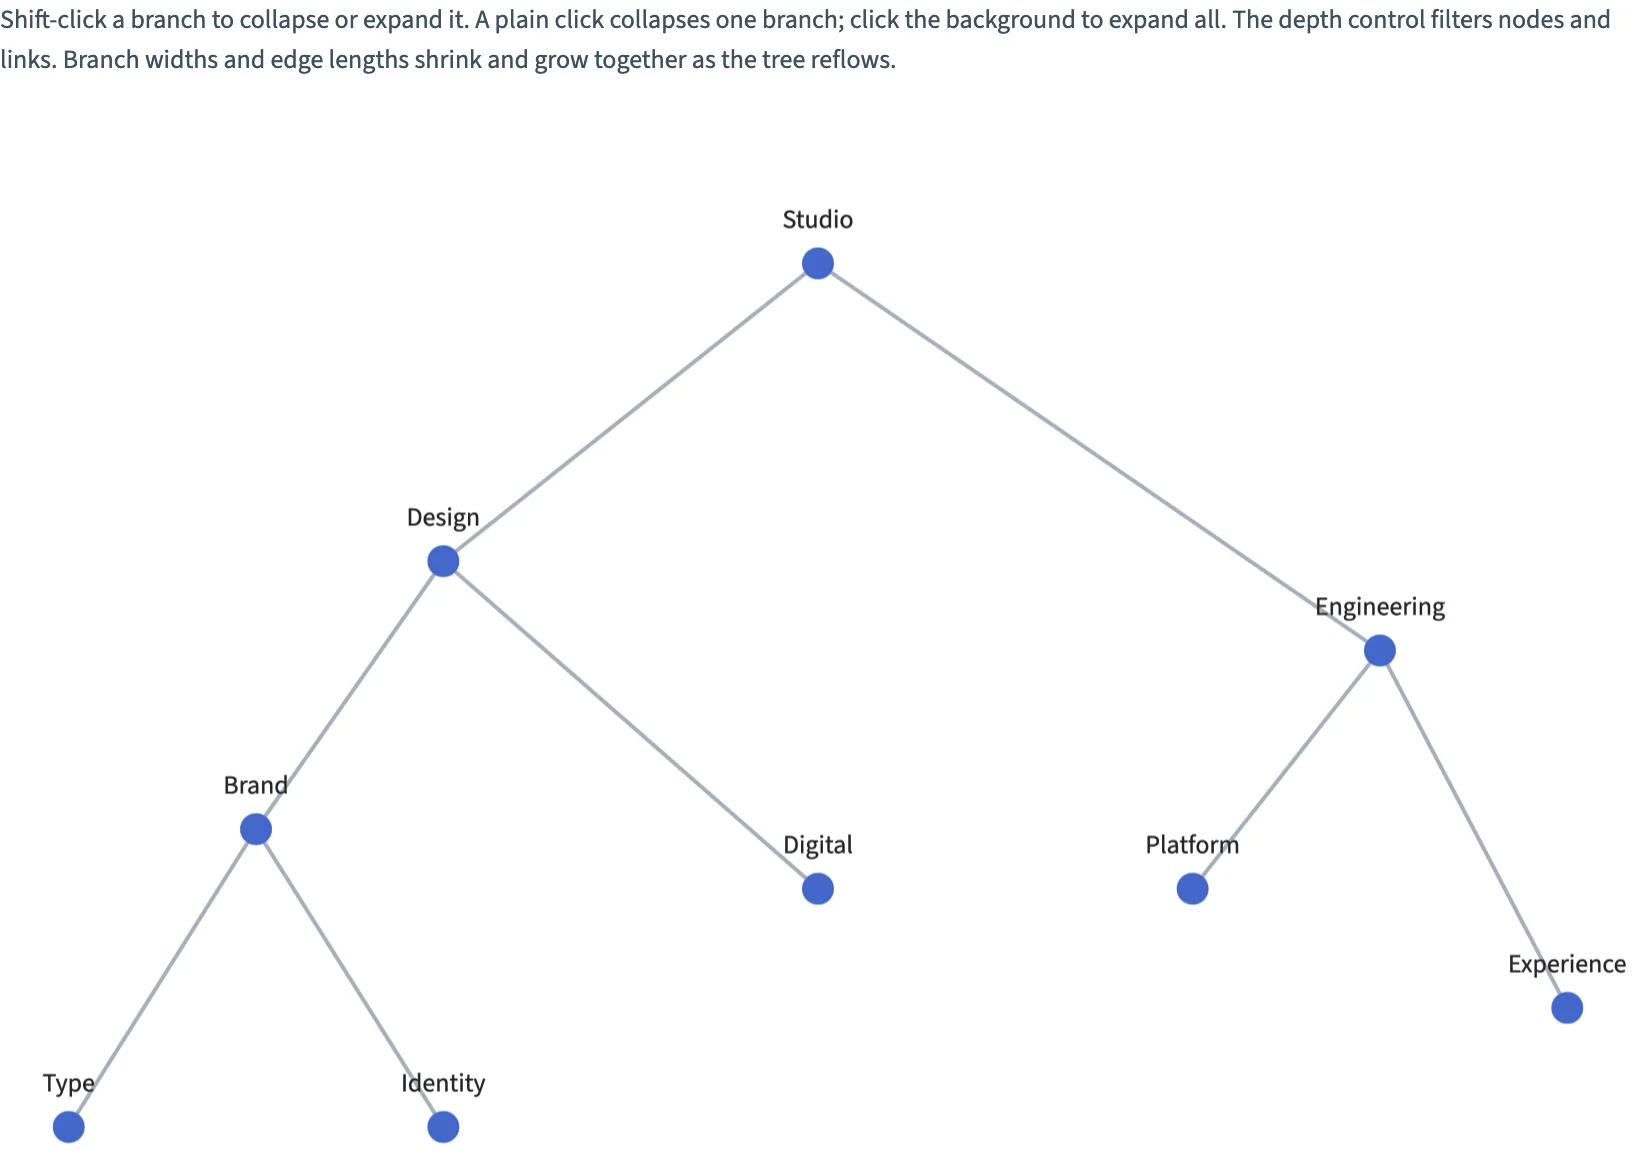
Static preview; loading the interactive plot
<script>
  import {
    Plot,
    Tree,
    Nodes,
    Filter,
    Points,
    Segments,
    Text,
    InputContext,
    Slider,
    Select,
    col,
    view,
    input,
    where,
    sum,
    equal,
    greater,
    less_equal,
    logical_and,
    logical_not,
    GraphData,
  } from "hmplot";
  import { untrack } from "svelte";
  let { onready } = $props(),
    plot = $state();
  const nodes = {
    id: [0, 1, 2, 3, 4, 5, 6, 7, 8],
    name: [
      "Studio",
      "Design",
      "Engineering",
      "Brand",
      "Digital",
      "Platform",
      "Experience",
      "Type",
      "Identity",
    ],
    level: [0, 1, 1, 2, 2, 2, 2, 3, 3],
    under0: [0, 1, 1, 1, 1, 1, 1, 1, 1],
    under1: [0, 0, 0, 1, 1, 0, 0, 1, 1],
    under2: [0, 0, 0, 0, 0, 1, 1, 0, 0],
    under3: [0, 0, 0, 0, 0, 0, 0, 1, 1],
  };
  const edges = {
    source: [0, 0, 1, 1, 2, 2, 3, 3],
    target: [1, 2, 3, 4, 5, 6, 7, 8],
    length: [1, 1.3, 0.9, 1.1, 0.8, 1.2, 1, 1],
  };
  // Selection stores collapsed branches. Test ancestors before filtering the node rows.
  const visible = [0, 1, 2, 3].reduce(
    (condition, id) =>
      logical_and(
        condition,
        logical_not(
          logical_and(
            col["under" + id],
            greater(sum(where(equal(col.id, id), view.selected, 0)), 0),
          ),
        ),
      ),
    true,
  );
  $effect(() => {
    const p = plot;
    untrack(() => onready?.(p));
  });
</script>

<p>
  Shift-click a branch to collapse or expand it. A plain click collapses one
  branch; click the background to expand all. The depth control filters nodes
  and links. Branch widths and edge lengths shrink and grow together as the tree
  reflows.
</p>
<InputContext>
  <div class="controls">
    <Slider
      name="depth"
      label="Visible depth"
      min={0}
      max={3}
      step={1}
      value={3}
    />
    <Select
      name="orientation"
      label="Orientation"
      options={["down", "right", "up", "left"]}
    />
  </div>
  <Plot bind:this={plot} data={edges} responsive height={480} axes2d={false}>
    <GraphData {nodes} {edges} nodeKey="id" source="source" target="target"
      ><Tree
        root={0}
        directed
        orientation={input("orientation")}
        mode="tidy-approx"
        edgeLength="length"
        where={logical_and(visible, less_equal(col.level, input("depth")))}
        enter={{ nodeWidth: 0, edgeLength: 0 }}
        exit={{ nodeWidth: 0, edgeLength: 0 }}
        animationDuration={600}
      >
        <Nodes>
          <Filter where={greater(col.depth, 0)}>
            <Segments
              start="parentPosition"
              end="position"
              opacity="presence"
              color="#a6afba"
              width={2}
            />
          </Filter>
          <Points
            x="x"
            y="y"
            size={where(view.selected, 20, 16)}
            fill="#4368ca"
            opacity="presence"
            select
            respond={false}
            tooltip={["name", "depth"]}
          />
          <Text
            x="x"
            y="y"
            opacity="presence"
            text="name"
            dy={-21}
            size={13}
          />
        </Nodes>
      </Tree></GraphData
    >
  </Plot>
</InputContext>

<style>
  .controls {
    display: flex;
    gap: 20px;
    flex-wrap: wrap;
  }
  p {
    font-size: 14px;
    line-height: 1.5;
  }
</style>