Dragging points
Drag a point in a scatterplot matrix: the drag writes offsets on the table's rows, and every cell that reads moved() of the dragged column follows.
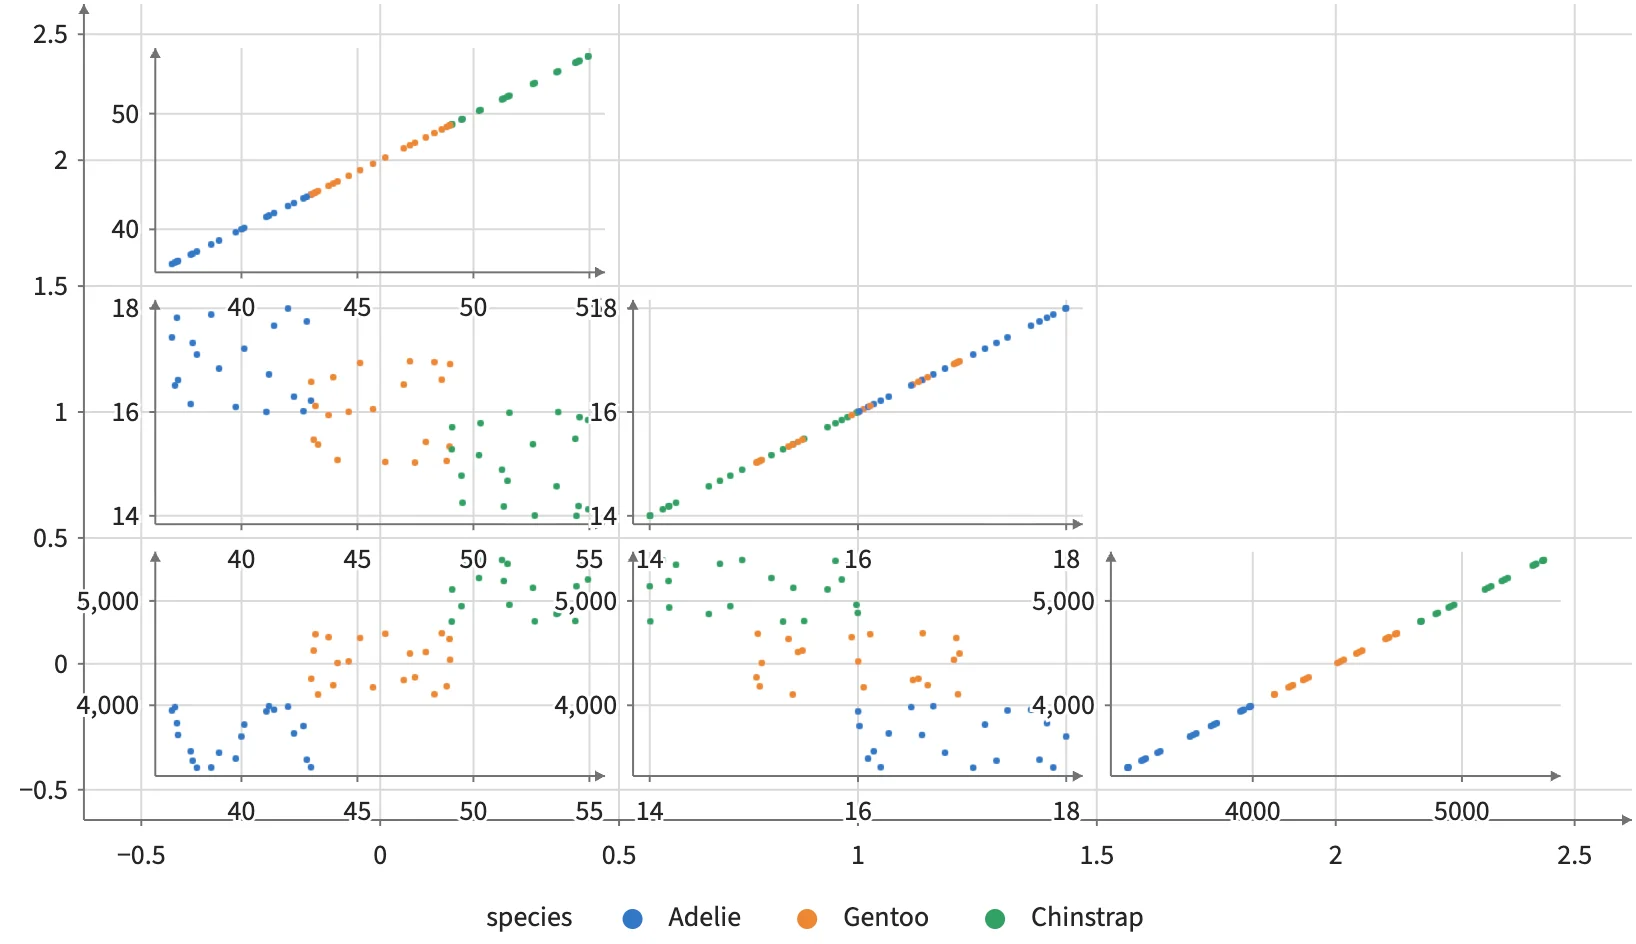
Static preview; loading the interactive plot
<Data value={penguins} key="id">
  <Plot axes2d>
    <Facet pairs={["bill", "depth", "mass"]} triangle="lower">
      <Points x={moved("x")} y={moved("y")} fill="species" select drag
        ondragend={(event) => console.log(event.keys, event.changes)} />
    </Facet>
  </Plot>
</Data>