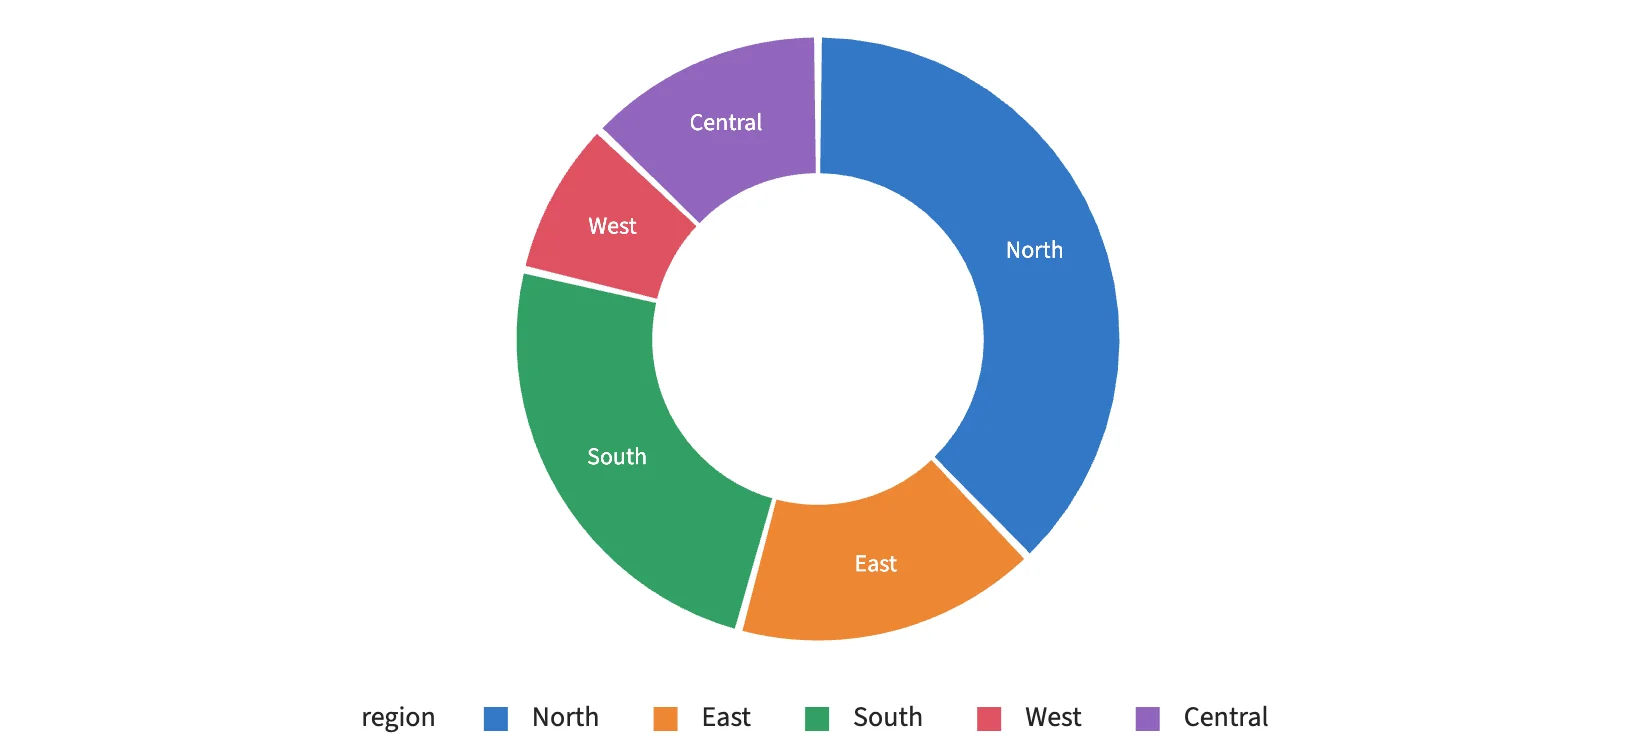
Donut chart
innerRadius opens the hole and padAngle separates the sectors. Keyed rows tween each sector's angles when the values change.
Static preview; loading the interactive plot
<script>
  import { Plot } from "hmplot";
import { Pie } from "hmplot/charts";
  const regions = ["North", "East", "South", "West", "Central"];
  let sales = $state([42, 18, 27, 9, 14]);
  // Next month: new values for the same keys tween each sector's angles.
  const next = () => (sales = sales.map(() => 8 + Math.round(40 * Math.random())));
</script>
<button onclick={next}>Next month</button>
<Plot data={{ region: regions, sales }} key="region" responsive height={380}>
  <Pie value="sales" category="region" innerRadius={0.55} padAngle={1.5} sectorLabel="category"
    animation animationDuration={700} />
</Plot>