Custom point shapes
Register polygons as point shapes and map a column to them with shape and shapeScale; the legend and SVG export draw the same polygons.
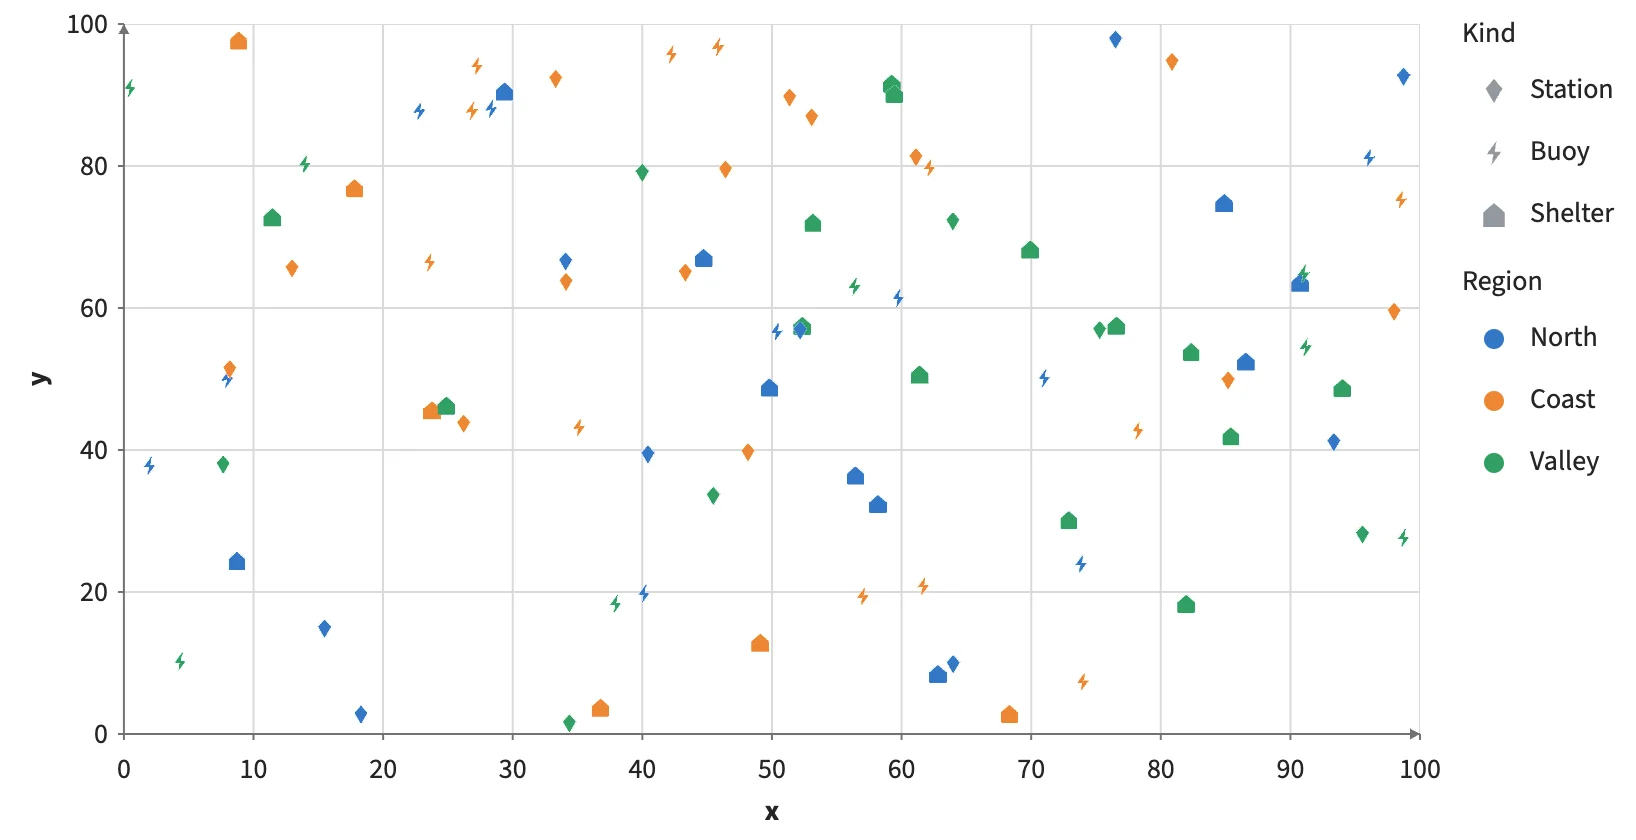
Static preview; loading the interactive plot
<script>
  import { Plot, Points, Legend, categorical, registerShape } from "hmplot";
  let points = $state();
  // Custom polygons in the unit square [-1, 1], y up: vertex lists or M/L/Z paths.
  registerShape("kite", [[0, 1], [0.7, 0.2], [0, -1], [-0.7, 0.2]]);
  registerShape("bolt", "M0.2 1 L-0.6 -0.1 L-0.05 -0.1 L-0.2 -1 L0.6 0.1 L0.05 0.1 Z");
  registerShape("house", [[0, 1], [0.9, 0.2], [0.9, -1], [-0.9, -1], [-0.9, 0.2]]);
  const noise = (i, k) => { const v = Math.sin(i * 12.9898 + k * 78.233) * 43758.5453; return v - Math.floor(v); };
  const kinds = ["Station", "Buoy", "Shelter"], regions = ["North", "Coast", "Valley"];
  const rows = Array.from({ length: 90 }, (_, i) => ({ kind: kinds[i % 3], region: regions[Math.floor(noise(i, 3) * 3)],
    x: 100 * noise(i, 1), y: 100 * noise(i, 2) }));
  const data = Object.fromEntries(Object.keys(rows[0]).map((key) => [key, rows.map((row) => row[key])]));
  const symbols = categorical({ domain: kinds, range: ["kite", "bolt", "house"] });
</script>
<Plot data={data} responsive height={420} axes2d x={{ domain: [0, 100] }} y={{ domain: [0, 100] }}>
  <Points bind:this={points} x="x" y="y" shape="kind" shapeScale={symbols} fill="region" size={9} />
  <Legend for={points} channel="shape" label="Kind" position="right" />
  <Legend for={points} channel="fill" label="Region" position="right" />
</Plot>