Custom colormaps
A diverging colormap from three colors and a positioned ramp that saves its strongest colors for the top of the domain. Legends and exports follow.
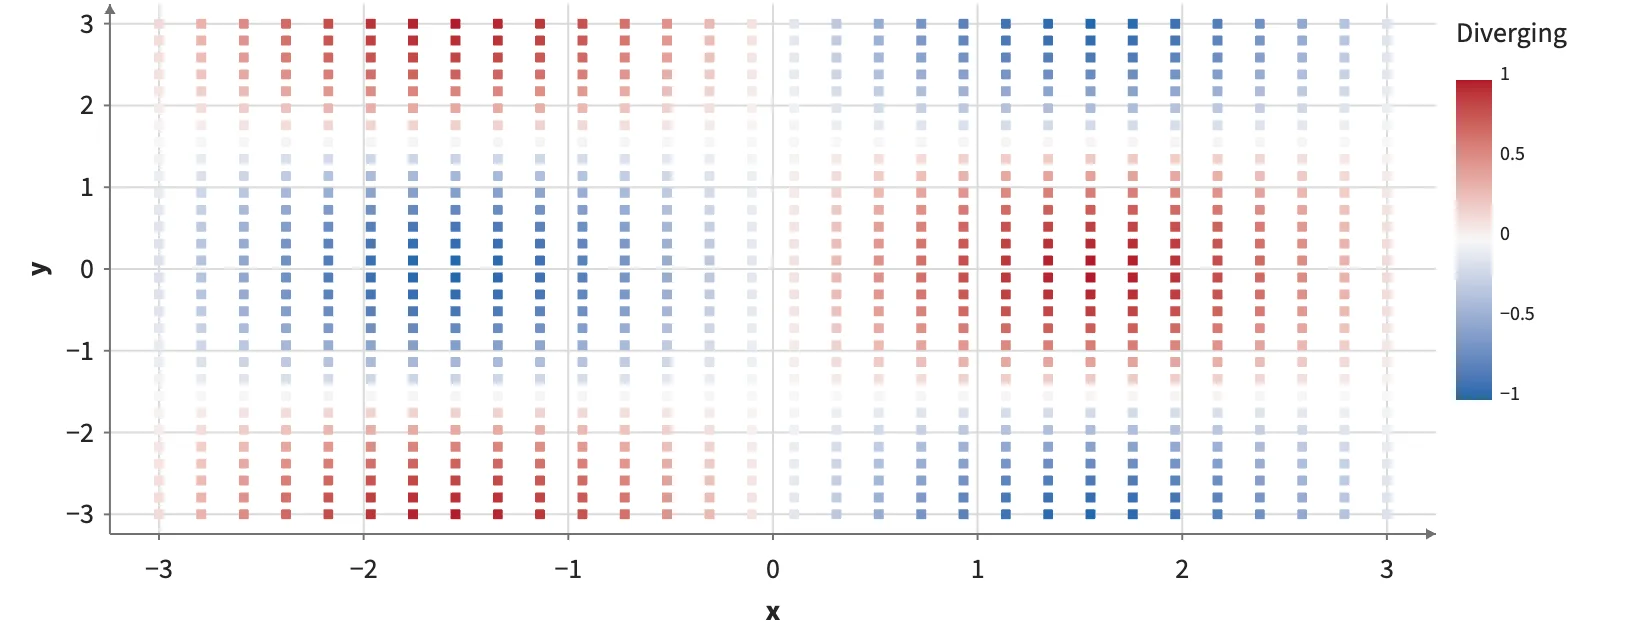
Static preview; loading the interactive plot
<script>
  import { Plot, Points, Legend, continuous } from "hmplot";
  let points = $state(), ranked = $state();
  const n = 900;
  const data = {
    x: Array.from({ length: n }, (_, i) => (i % 30) / 29 * 6 - 3),
    y: Array.from({ length: n }, (_, i) => Math.floor(i / 30) / 29 * 6 - 3),
  };
  data.value = data.x.map((x, i) => Math.sin(x) * Math.cos(data.y[i]));
  // A diverging map from three colors, interpolated in Lab.
  const diverging = continuous({ domain: [-1, 1], colormap: ["#2166ac", "#f7f7f7", "#b2182b"] });
  // Positions squeeze most of the ramp into the top tenth of the domain.
  const alert = continuous({ domain: [-1, 1], colormap: { colors: ["#e8eef4", "#9ab0c4", "#f2a900", "#d7301f"], positions: [0, 0.8, 0.9, 1] } });
</script>
<Plot data={data} responsive height={320} axes2d>
  <Points bind:this={points} x="x" y="y" fill="value" fillScale={diverging} shape="square" size={5} />
  <Legend for={points} channel="fill" label="Diverging" position="right" />
</Plot>
<Plot data={data} responsive height={320} axes2d>
  <Points bind:this={ranked} x="x" y="y" fill="value" fillScale={alert} shape="square" size={5} />
  <Legend for={ranked} channel="fill" label="Alert levels" position="right" />
</Plot>