Brushed filter chain
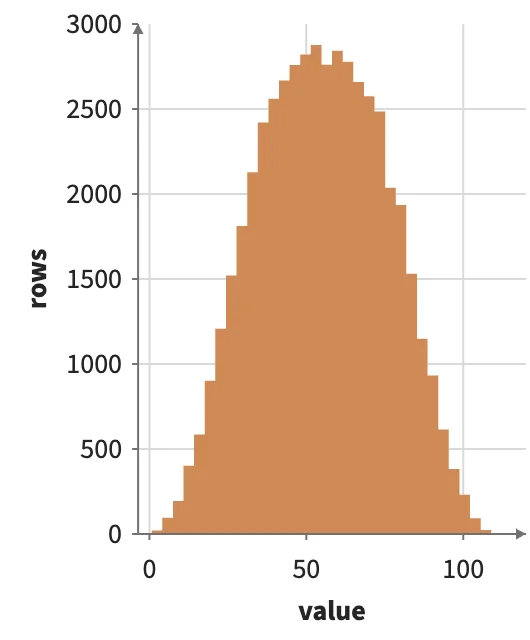
Shift-drag to brush 50,000 points; a histogram (Filter > Bin) and per-level means (Filter > Group) follow the brush. A Filter keeps its input's rows and marks the kept ones, so a moving brush changes no array length and compiles no new GPU kernels.
Static preview; loading the interactive plot
<script>
  import { Data, Plot, Points, Filter, Group, Rect, add, mean } from "hmplot";
import { Bin } from "hmplot/stats";
  // table: 50,000 rows with x, y (to brush), value, and level (the y band, 0-7).
</script>
<Data value={table}>
  <Plot axes2d x={{ domain: [0, 1] }} y={{ domain: [0, 1] }}>
    <Points x="x" y="y" size={1} brush maxElements={50000} />
  </Plot>
  <Plot axes2d>
    <Filter where="@brushed">
      <Bin x="value" bins={32}><Rect x0="x0" x1="x1" y0={0} y1="count" /></Bin>
    </Filter>
  </Plot>
  <Plot axes2d>
    <Filter where="@brushed">
      <Group by="level" columns={{ mean: mean("value") }}>
        <Rect x0="level" x1={add("level", 0.8)} y0={0} y1="mean" />
      </Group>
    </Filter>
  </Plot>
</Data>