Brushed distributions
Shift-drag to brush 60,000 points in five clusters; violins and box plots of each group's values are recomputed from the brushed rows on every move, with no GPU kernels compiled while dragging.
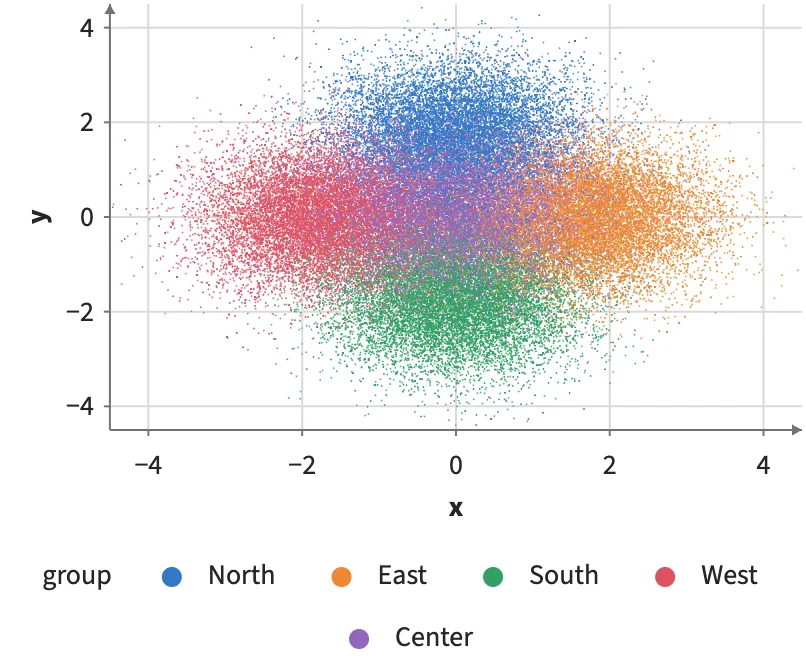
Static preview; loading the interactive plot
<script>
  import { Data, Plot, Points, Filter, categorical } from "hmplot";
import { Violin, BoxPlot } from "hmplot/charts";
  // table: 60,000 rows with x, y (to brush), group (five clusters) and value.
  const scale = categorical({ domain: ["North", "East", "South", "West", "Center"] });
</script>
<Data value={table}>
  <Plot axes2d>
    <Points x="x" y="y" size={1} fill="group" brush maxElements={60000} />
  </Plot>
  <Plot x={{ scale: scale }} axes2d>
    <Filter where="@brushed"><Violin x="group" y="value" fill="group" /></Filter>
  </Plot>
  <Plot x={{ scale: scale }} axes2d>
    <Filter where="@brushed"><BoxPlot x="group" y="value" fill="group" /></Filter>
  </Plot>
</Data>