animate, enter/exit, and @time
animate() moves one channel per row in its scale space (geometric on this log axis) with enter and exit values for rows that come and go, while @time satellites on fixed rows of their own orbit continuously without blocking settlement.
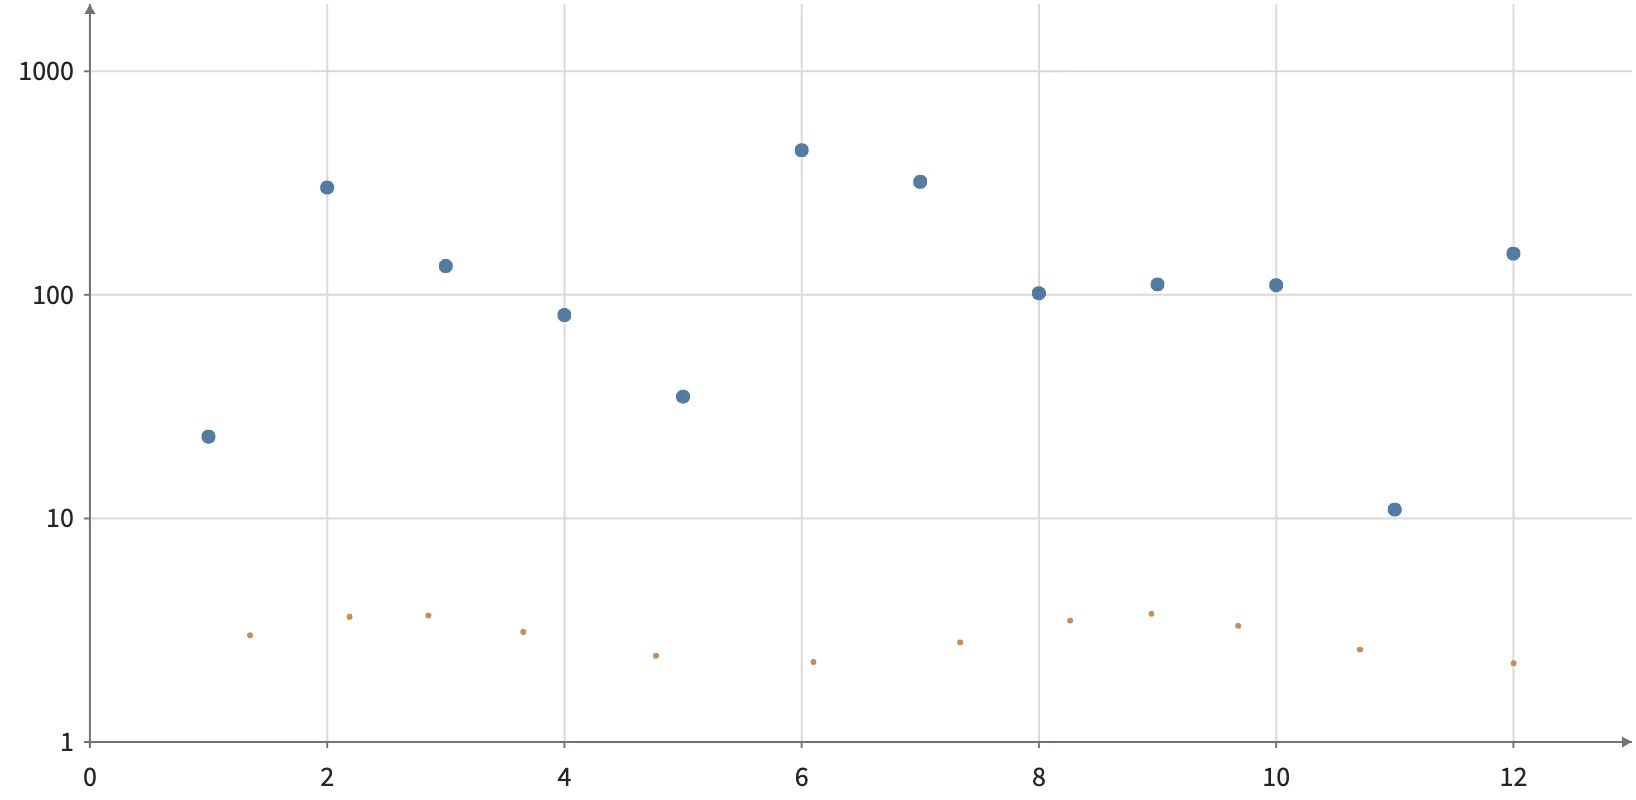
Static preview; loading the interactive plot
<script>
  import { Plot, Data, Points, animate, add, multiply, sin, cos, divide } from "hmplot";
  let step = $state(0);
  // The satellites' own fixed rows: a @time channel has no transition, so @time is their only motion.
  const slots = { x: [1, 2, 3, 4, 5, 6, 7, 8, 9, 10, 11, 12], y: Array(12).fill(3), angle: [0, 1, 2, 3, 4, 5, 6, 7, 8, 9, 10, 11] };
</script>
<button onclick={() => step++}>Next keyed update</button>
<Plot data={rows(step)} key="id" responsive height={400} axes2d
  x={{ domain: [0, 13] }} y={{ domain: [1, 2000], transform: "log" }}>
  <Points x="x" y={animate("y", { duration: 900, enter: 1, exit: 1500 })} size={7} />
  <Data value={slots}>
    <Points x={add("x", multiply(0.35, cos(add(divide("@time", 700), "angle"))))}
      y={multiply("y", add(1, multiply(0.25, sin(add(divide("@time", 700), "angle")))))} size={3} fill="#cf8955" />
  </Data>
</Plot>