Anchored frame
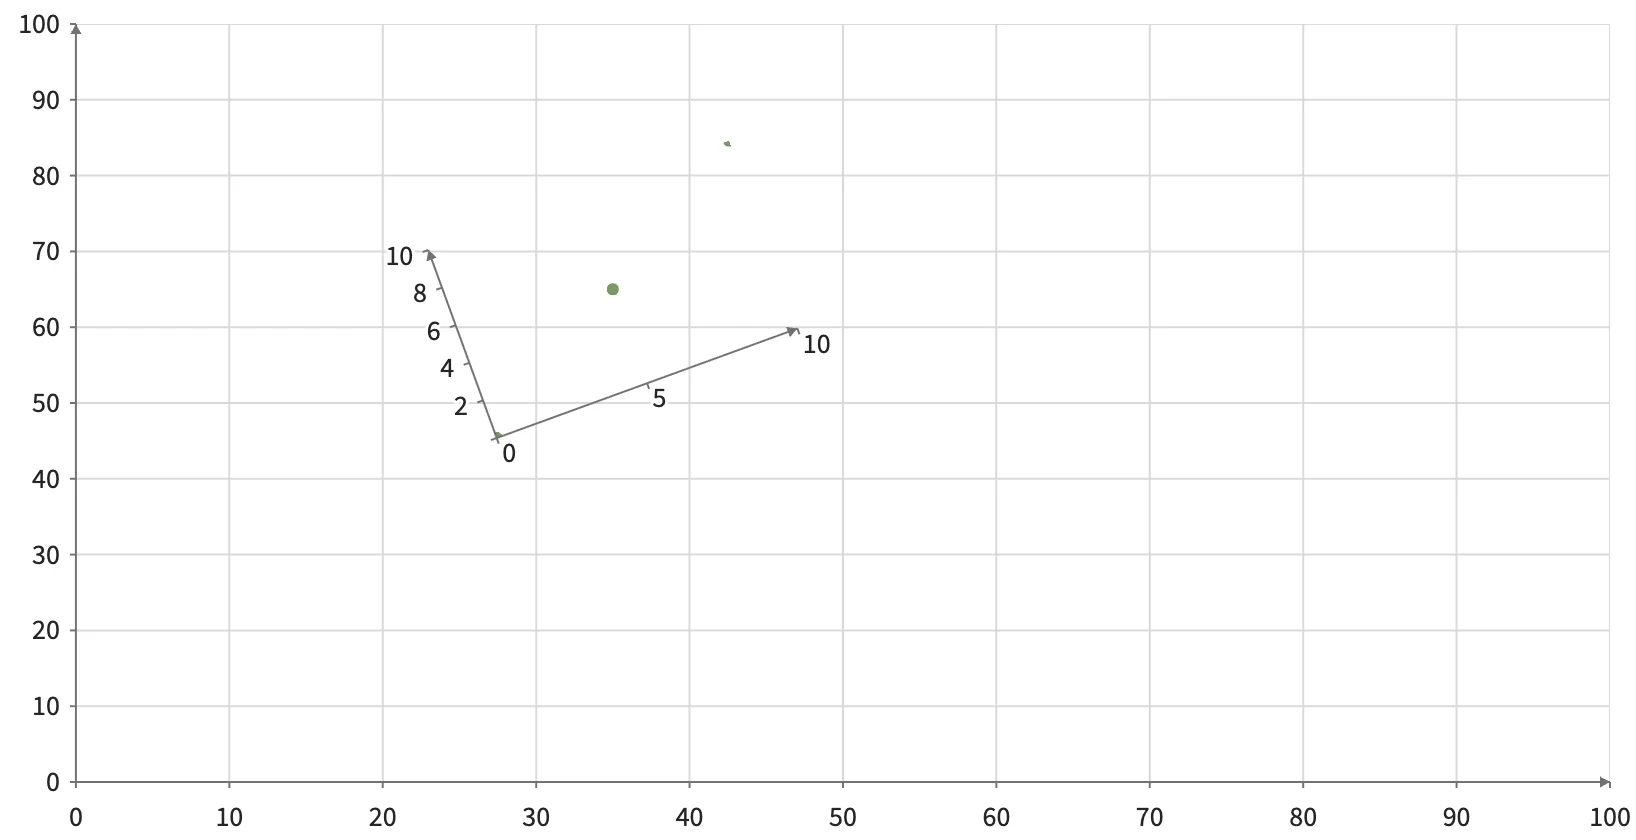
Pan and zoom: the child frame stays 160 by 100 CSS pixels, anchored at its parent data position.
Static preview; loading the interactive plot
<script>
  import { Plot, Frame, Points } from "hmplot";
</script>
<Plot responsive height={420} axes2d x={{domain:[0,100]}} y={{domain:[0,100]}}>
  <Frame placement={{anchor:[35,65], size:[160,100], rotation:[0,0,20]}}
    x={{domain:[0,10]}} y={{domain:[0,10]}}>
    <Points position={[[0,0],[5,5],[10,10]]} size={6} fill="#7b9865" />
  </Frame>
</Plot>